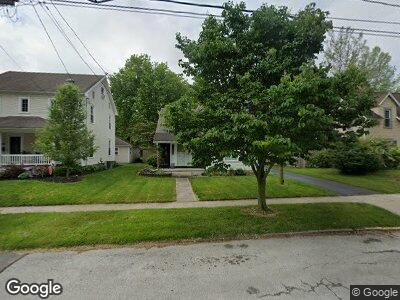
647 Wallace Ave Bowling Green, OH 43402
Estimated Value: $254,000 - $264,532
4
Beds
2
Baths
2,090
Sq Ft
$124/Sq Ft
Est. Value
About This Home
This home is located at 647 Wallace Ave, Bowling Green, OH 43402 and is currently estimated at $258,133, approximately $123 per square foot. 647 Wallace Ave is a home located in Wood County with nearby schools including Bowling Green High School, Montessori School Of Bowling Green, and Bowling Green Christian Academy.
Ownership History
Date
Name
Owned For
Owner Type
Purchase Details
Closed on
Aug 31, 2007
Sold by
Hetherington Eric H and Hetherington Vonda K
Bought by
Clark Jason M and Clark Laura L
Current Estimated Value
Home Financials for this Owner
Home Financials are based on the most recent Mortgage that was taken out on this home.
Original Mortgage
$120,000
Interest Rate
6.79%
Mortgage Type
Purchase Money Mortgage
Purchase Details
Closed on
Jul 27, 1999
Sold by
Reed Mancuso Nancy
Bought by
Hetherington Eric H and Hetherington Vonda K
Home Financials for this Owner
Home Financials are based on the most recent Mortgage that was taken out on this home.
Original Mortgage
$124,200
Interest Rate
7.54%
Purchase Details
Closed on
Jan 1, 1990
Bought by
Mancuso Joseph J
Create a Home Valuation Report for This Property
The Home Valuation Report is an in-depth analysis detailing your home's value as well as a comparison with similar homes in the area
Home Values in the Area
Average Home Value in this Area
Purchase History
| Date | Buyer | Sale Price | Title Company |
|---|---|---|---|
| Clark Jason M | $150,000 | Attorney | |
| Hetherington Eric H | $138,000 | Assured Title Agency Inc | |
| Mancuso Joseph J | -- | -- |
Source: Public Records
Mortgage History
| Date | Status | Borrower | Loan Amount |
|---|---|---|---|
| Open | Clark Jason M | $39,500 | |
| Open | Clark Jason M | $132,000 | |
| Closed | Clark Jason M | $123,400 | |
| Closed | Clark Jason M | $120,000 | |
| Closed | Clark Jason M | $22,500 | |
| Closed | Hetherington Eric H | $118,638 | |
| Closed | Hetherington Eric H | $9,362 | |
| Closed | Hetherington Eric H | $124,200 |
Source: Public Records
Tax History Compared to Growth
Tax History
| Year | Tax Paid | Tax Assessment Tax Assessment Total Assessment is a certain percentage of the fair market value that is determined by local assessors to be the total taxable value of land and additions on the property. | Land | Improvement |
|---|---|---|---|---|
| 2023 | $3,161 | $73,330 | $11,800 | $61,530 |
| 2021 | $2,537 | $58,600 | $9,840 | $48,760 |
| 2020 | $2,544 | $58,600 | $9,840 | $48,760 |
| 2019 | $2,284 | $50,130 | $9,840 | $40,290 |
| 2018 | $2,270 | $50,130 | $9,840 | $40,290 |
| 2017 | $2,244 | $50,130 | $9,840 | $40,290 |
| 2016 | $1,781 | $39,350 | $11,800 | $27,550 |
| 2015 | $1,781 | $39,350 | $11,800 | $27,550 |
| 2014 | $1,836 | $39,350 | $11,800 | $27,550 |
| 2013 | $1,977 | $39,350 | $11,800 | $27,550 |
Source: Public Records
Map
Nearby Homes
- 550 Wallace Ave
- 825 Wallace Ave
- 160 Winfield Dr
- 150 Buttonwood Ave
- 410 S Maple St
- 416 Donbar Dr
- 521 Erie Ct
- 502 N Prospect St
- 1230 Alexandria Blvd
- 1110 Bourgogne Ave
- 510 N Wintergarden Rd
- 651 Flanders Ave
- 1351 Kensington Blvd
- 1044 W Poe Rd
- 1362 Conneaut Ave
- 215 Ada Ave
- 1057 Sparrow Ln
- 319 Sunrise Dr
- 1304 N Orleans Ave
- 1048 N Main St Unit 103
- 647 Wallace Ave
- 643 Wallace Ave
- 701 Wallace Ave
- 637 Wallace Ave
- 711 Wallace Ave
- 633 Wallace Ave
- 715 Wallace Ave
- 209 Meeker St
- 209 Meeker St
- 209 Meeker St
- 209 Meeker St
- 209 Meeker St
- 209 Meeker St
- 648 Wallace Ave
- 627 Wallace Ave
- 644 Wallace Ave
- 702 Wallace Ave
- 636 Wallace Ave
- 708 Wallace Ave
- 204 Haskins Rd