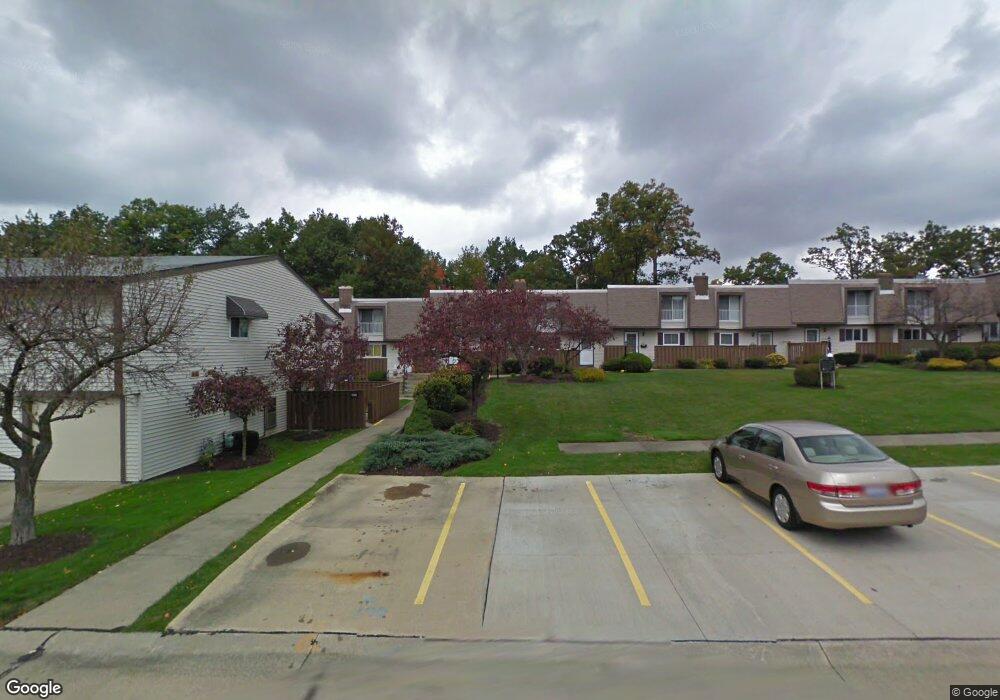
6470 State Rd Unit K20 Cleveland, OH 44134
Estimated Value: $143,868 - $167,000
2
Beds
2
Baths
1,035
Sq Ft
$150/Sq Ft
Est. Value
About This Home
This home is located at 6470 State Rd Unit K20, Cleveland, OH 44134 and is currently estimated at $155,467, approximately $150 per square foot. 6470 State Rd Unit K20 is a home located in Cuyahoga County with nearby schools including Dentzler Elementary School, Parma High School, and St Anthony Padua School.
Ownership History
Date
Name
Owned For
Owner Type
Purchase Details
Closed on
Jun 15, 2020
Sold by
Shipka Helen and Tharp Susan A
Bought by
Tharp Susan A
Current Estimated Value
Purchase Details
Closed on
Sep 10, 2003
Sold by
Shipka Walter and Shipka Helen
Bought by
Shipka Helen and Shipka Walter
Purchase Details
Closed on
Sep 4, 1998
Sold by
Lehnert Frank A
Bought by
Shipka Walter and Shipka Helen
Purchase Details
Closed on
Jun 25, 1986
Sold by
Nuzzo Charles N
Bought by
Lehnert Theresa
Purchase Details
Closed on
Jun 27, 1984
Sold by
Nuzzo Nick and Nuzzo Bessie
Bought by
Nuzzo Charles N
Purchase Details
Closed on
May 1, 1979
Sold by
Josephine A Mercier
Bought by
Nuzzo Nick and Nuzzo Bessie
Purchase Details
Closed on
Jan 4, 1978
Sold by
Stenger James A and Stenger Brenda P
Bought by
Mercier Roger M
Purchase Details
Closed on
Jan 1, 1975
Bought by
Stenger James A and Stenger Brenda P
Create a Home Valuation Report for This Property
The Home Valuation Report is an in-depth analysis detailing your home's value as well as a comparison with similar homes in the area
Home Values in the Area
Average Home Value in this Area
Purchase History
| Date | Buyer | Sale Price | Title Company |
|---|---|---|---|
| Tharp Susan A | -- | None Available | |
| Shipka Helen | -- | -- | |
| Shipka Walter | $85,000 | -- | |
| Lehnert Theresa | $62,000 | -- | |
| Nuzzo Charles N | -- | -- | |
| Nuzzo Nick | $53,000 | -- | |
| Josephine A Mercier | -- | -- | |
| Mercier Roger M | $45,500 | -- | |
| Stenger James A | -- | -- |
Source: Public Records
Tax History Compared to Growth
Tax History
| Year | Tax Paid | Tax Assessment Tax Assessment Total Assessment is a certain percentage of the fair market value that is determined by local assessors to be the total taxable value of land and additions on the property. | Land | Improvement |
|---|---|---|---|---|
| 2024 | $2,690 | $44,415 | $4,445 | $39,970 |
| 2023 | $2,100 | $30,280 | $3,050 | $27,230 |
| 2022 | $2,084 | $30,280 | $3,050 | $27,230 |
| 2021 | $2,152 | $30,280 | $3,050 | $27,230 |
| 2020 | $1,903 | $23,660 | $2,380 | $21,280 |
| 2019 | $1,850 | $67,600 | $6,800 | $60,800 |
| 2018 | $1,886 | $23,660 | $2,380 | $21,280 |
| 2017 | $1,922 | $22,900 | $2,280 | $20,620 |
| 2016 | $1,912 | $22,900 | $2,280 | $20,620 |
| 2015 | $2,215 | $22,900 | $2,280 | $20,620 |
| 2014 | $2,215 | $26,920 | $2,700 | $24,220 |
Source: Public Records
Map
Nearby Homes
- 6468 State Rd Unit L11
- 6474 State Rd Unit I-10
- 6482 Concord Dr
- 4001 W Ridgewood Dr
- 0 Orchard Park Dr
- 5208 Orchard Park Dr
- 5700 Hollywood Dr
- 4702 Longwood Ave
- 5200 Heather Field Cir Unit C2
- 5610 Warwick Dr
- 5205 Woodrow Ave
- 3407 Dellwood Dr
- 4302 Woodrow Ave
- 6189 W 54th St
- 6813 Rolling Meadow Dr
- 5415 Pelham Dr
- 4802 Grantwood Dr
- 6431 W Ridgewood Dr
- 3100 W Ridgewood Dr
- 3122 Dellwood Dr
- 6470 State Rd Unit K12
- 6470 State Rd
- 6470 State Rd
- 6470 State Rd
- 6470 State Rd Unit K14
- 6470 State Rd Unit K15
- 6470 State Rd Unit K-7
- 6470 State Rd Unit K-9
- 6470 State Rd Unit K10
- 6470 State Rd Unit k6
- 6470 State Rd Unit K-18
- 6468 State Rd Unit L1
- 6468 State Rd Unit L9
- 6468 State Rd
- 6468 State Rd Unit L16
- 6468 State Rd Unit L15
- 6470 Concord Dr Unit K-15
- 6468 Concord Dr
- 6468 State Rd Unit L-3
- 6470 Concord Dr