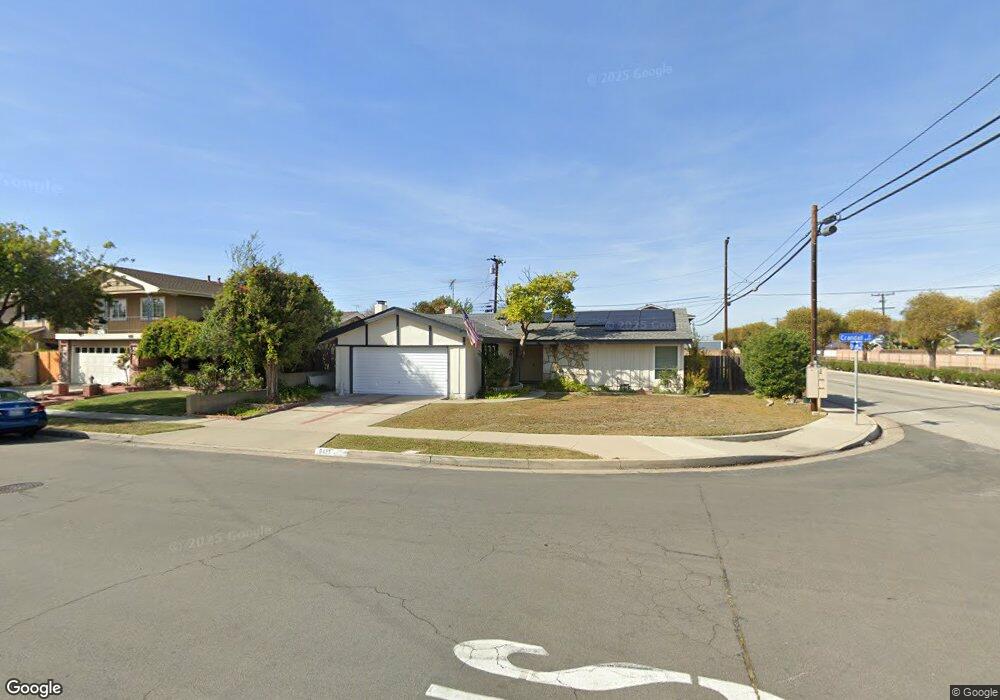
6471 Crandall Dr Huntington Beach, CA 92647
Estimated Value: $1,149,000 - $1,301,000
4
Beds
2
Baths
1,389
Sq Ft
$874/Sq Ft
Est. Value
About This Home
This home is located at 6471 Crandall Dr, Huntington Beach, CA 92647 and is currently estimated at $1,213,574, approximately $873 per square foot. 6471 Crandall Dr is a home located in Orange County with nearby schools including Circle View Elementary School, Spring View Middle School, and Marina High School.
Ownership History
Date
Name
Owned For
Owner Type
Purchase Details
Closed on
Nov 14, 2017
Sold by
Spilitter William Edward
Bought by
Splitter William E
Current Estimated Value
Home Financials for this Owner
Home Financials are based on the most recent Mortgage that was taken out on this home.
Original Mortgage
$954,225
Interest Rate
3.85%
Mortgage Type
Reverse Mortgage Home Equity Conversion Mortgage
Purchase Details
Closed on
Aug 12, 2013
Sold by
Splitter William E
Bought by
Splitter William Edward and Craig Trust
Home Financials for this Owner
Home Financials are based on the most recent Mortgage that was taken out on this home.
Original Mortgage
$374,000
Interest Rate
4.51%
Mortgage Type
New Conventional
Purchase Details
Closed on
Apr 28, 2008
Sold by
Splitter William Edward
Bought by
Splitter William Edward and The Craig Trust
Create a Home Valuation Report for This Property
The Home Valuation Report is an in-depth analysis detailing your home's value as well as a comparison with similar homes in the area
Home Values in the Area
Average Home Value in this Area
Purchase History
| Date | Buyer | Sale Price | Title Company |
|---|---|---|---|
| Splitter William E | -- | First American Title Co | |
| Splitter William Edward | -- | Accommodation | |
| Splitter William E | -- | Wfg Title Company Of Ca | |
| Splitter William Edward | -- | None Available |
Source: Public Records
Mortgage History
| Date | Status | Borrower | Loan Amount |
|---|---|---|---|
| Closed | Splitter William E | $954,225 | |
| Closed | Splitter William E | $374,000 |
Source: Public Records
Tax History Compared to Growth
Tax History
| Year | Tax Paid | Tax Assessment Tax Assessment Total Assessment is a certain percentage of the fair market value that is determined by local assessors to be the total taxable value of land and additions on the property. | Land | Improvement |
|---|---|---|---|---|
| 2025 | $1,235 | $85,678 | $31,715 | $53,963 |
| 2024 | $1,235 | $83,999 | $31,094 | $52,905 |
| 2023 | $1,202 | $82,352 | $30,484 | $51,868 |
| 2022 | $1,178 | $80,738 | $29,887 | $50,851 |
| 2021 | $1,157 | $79,155 | $29,301 | $49,854 |
| 2020 | $1,143 | $78,344 | $29,001 | $49,343 |
| 2019 | $1,127 | $76,808 | $28,432 | $48,376 |
| 2018 | $1,104 | $75,302 | $27,874 | $47,428 |
| 2017 | $1,085 | $73,826 | $27,327 | $46,499 |
| 2016 | $1,049 | $72,379 | $26,791 | $45,588 |
| 2015 | $1,031 | $71,292 | $26,388 | $44,904 |
| 2014 | $1,009 | $69,896 | $25,871 | $44,025 |
Source: Public Records
Map
Nearby Homes
- 6582 Corrine Cir
- 6351 Gloria Dr
- 6292 Heil Ave
- 16401 Mercier Ln
- 6301 Warner Ave Unit 40
- 6301 Warner Ave Unit 88
- 16892 Limelight Cir Unit B
- 6672 Sun Dr Unit B
- 6241 Warner Ave Unit 108
- 6600 Warner Ave Unit 119
- 6600 Warner Ave Unit 50
- 6600 Warner Ave
- 6600 Warner Ave Unit 144
- 6600 Warner Ave Unit 142
- 16722 Goldenwest St
- 7002 Valentine Dr
- 16261 Angler Ln
- 6631 Walton Dr
- 17071 Pinehurst Ln
- 7223 Alchemy Cir
- 6451 Crandall Dr
- 6472 Weber Cir
- 6452 Weber Cir
- 6441 Crandall Dr
- 6442 Weber Cir
- 6472 Crandall Dr
- 6502 Corrine Cir
- 6452 Crandall Dr
- 6501 Peggy Cir
- 6431 Crandall Dr
- 6442 Crandall Dr
- 6522 Corrine Cir
- 6501 Corrine Cir
- 6432 Crandall Dr
- 6421 Crandall Dr
- 6521 Peggy Cir
- 6461 Camille Dr
- 6422 Weber Cir
- 6471 Weber Cir
- 6451 Weber Cir