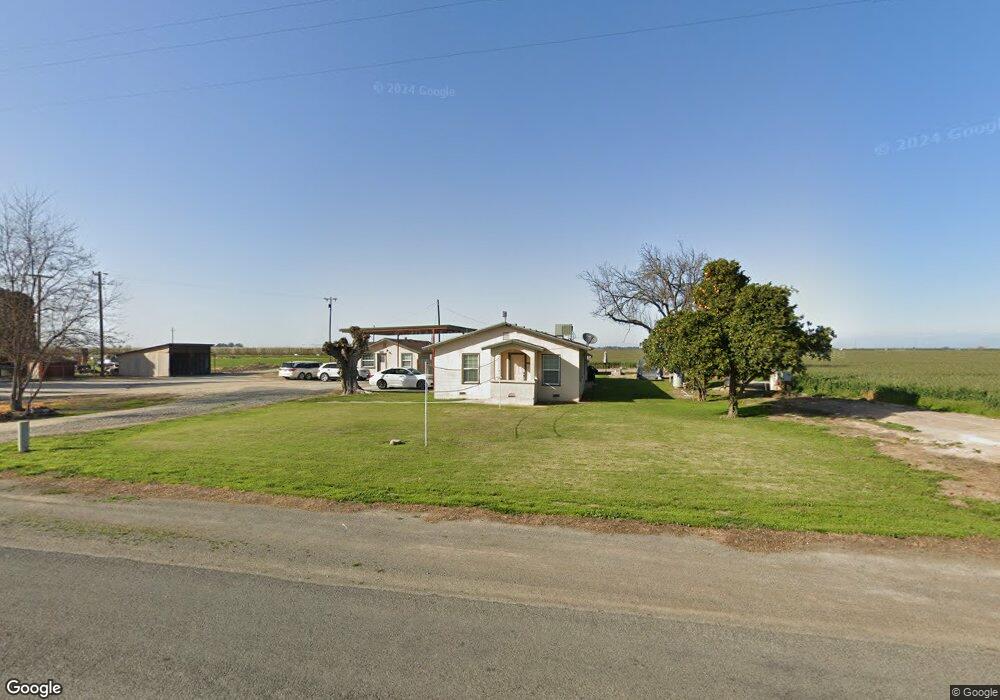
6474 Flint Ave Hanford, CA 93230
Estimated Value: $652,000 - $1,806,092
3
Beds
1
Bath
1,508
Sq Ft
$761/Sq Ft
Est. Value
About This Home
This home is located at 6474 Flint Ave, Hanford, CA 93230 and is currently estimated at $1,147,364, approximately $760 per square foot. 6474 Flint Ave is a home located in Kings County with nearby schools including Kit Carson Elementary School, Hanford High School, and Mid Valley Charter Home School.
Ownership History
Date
Name
Owned For
Owner Type
Purchase Details
Closed on
Mar 9, 2017
Sold by
Wilgenburg Bert and Wilgenburg Tanis
Bought by
Wilgenburg Family Limited Partnership
Current Estimated Value
Purchase Details
Closed on
Dec 19, 2016
Sold by
Wilgenburg Bert and Wilgenburg Tanis
Bought by
Wilgenburg Lucas
Purchase Details
Closed on
Jul 30, 2008
Sold by
Wilgenburg Bert and Wilgenburg Tanis
Bought by
Wilgenburg Bert and Wilgenburg Tanis
Create a Home Valuation Report for This Property
The Home Valuation Report is an in-depth analysis detailing your home's value as well as a comparison with similar homes in the area
Home Values in the Area
Average Home Value in this Area
Purchase History
| Date | Buyer | Sale Price | Title Company |
|---|---|---|---|
| Wilgenburg Family Limited Partnership | -- | None Available | |
| Wilgenburg Lucas | -- | None Available | |
| Wilgenburg Bert | -- | None Available |
Source: Public Records
Tax History
| Year | Tax Paid | Tax Assessment Tax Assessment Total Assessment is a certain percentage of the fair market value that is determined by local assessors to be the total taxable value of land and additions on the property. | Land | Improvement |
|---|---|---|---|---|
| 2025 | $5,172 | $440,590 | $354,031 | $86,559 |
| 2023 | $5,172 | $341,615 | $258,416 | $83,199 |
| 2022 | $3,385 | $277,446 | $195,878 | $81,568 |
| 2021 | $3,471 | $288,022 | $208,053 | $79,969 |
| 2020 | $3,273 | $265,313 | $186,164 | $79,149 |
| 2019 | $3,193 | $255,283 | $177,686 | $77,597 |
| 2018 | $2,977 | $234,336 | $158,261 | $76,075 |
| 2017 | $3,238 | $263,044 | $188,461 | $74,583 |
| 2016 | $3,662 | $309,917 | $236,796 | $73,121 |
| 2015 | $3,796 | $323,180 | $251,157 | $72,023 |
| 2014 | $3,364 | $278,545 | $207,933 | $70,612 |
Source: Public Records
Map
Nearby Homes
- 6900 Grangeville Blvd
- 0 Elder Ave Unit 643716
- 0 Elder Ave Unit 26308518
- 0 Elder Ave Unit 239756
- 982 Cedarwood St
- 974 Cedarwood St
- 1340 Waterview St
- 950 Cedarwood St
- 1306 Waterview St
- 2411 Cottonwood Dr
- 98379 9 1 4 Ave
- 969 Lakewood Dr
- 1915 Valley Springs Ave
- 2202 Cottonwood Ct
- 6505 10th Ave
- 926 Birchwood Ct
- 8650 Lacey Blvd
- 5757 10th Ave
- 1295 Lassen Dr
- 860 E Grangeville Spc 113 Blvd
Your Personal Tour Guide
Ask me questions while you tour the home.