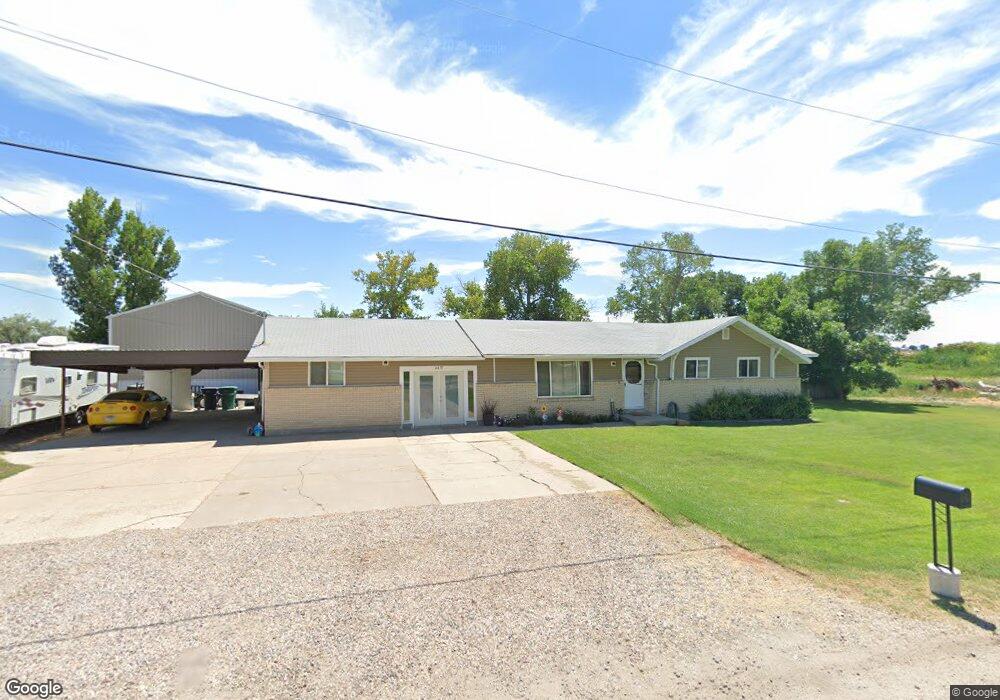
6475 W 5100 S Hooper, UT 84315
Estimated Value: $543,000 - $648,000
3
Beds
1
Bath
2,025
Sq Ft
$297/Sq Ft
Est. Value
About This Home
This home is located at 6475 W 5100 S, Hooper, UT 84315 and is currently estimated at $601,192, approximately $296 per square foot. 6475 W 5100 S is a home located in Weber County with nearby schools including Hooper Elementary School, Rocky Mountain Junior High School, and Fremont High School.
Ownership History
Date
Name
Owned For
Owner Type
Purchase Details
Closed on
Jan 20, 2022
Sold by
Higgs Daniel S
Bought by
Higgs Daniel S and Scadden Lynda Boyle
Current Estimated Value
Purchase Details
Closed on
Feb 15, 2012
Sold by
Higgs Daniel S
Bought by
Higgs Daniel S and Higgs Connie Jo
Purchase Details
Closed on
Dec 18, 2008
Sold by
Higgs Daniel S
Bought by
Higgs Daniel S and Higgs Connie Jo
Home Financials for this Owner
Home Financials are based on the most recent Mortgage that was taken out on this home.
Original Mortgage
$185,185
Interest Rate
6.03%
Mortgage Type
FHA
Purchase Details
Closed on
Aug 12, 2003
Sold by
Hornbuckle George H and Hornbuckle Kay V
Bought by
Higgs Daniel S
Home Financials for this Owner
Home Financials are based on the most recent Mortgage that was taken out on this home.
Original Mortgage
$136,000
Interest Rate
5.29%
Mortgage Type
Purchase Money Mortgage
Create a Home Valuation Report for This Property
The Home Valuation Report is an in-depth analysis detailing your home's value as well as a comparison with similar homes in the area
Home Values in the Area
Average Home Value in this Area
Purchase History
| Date | Buyer | Sale Price | Title Company |
|---|---|---|---|
| Higgs Daniel S | -- | None Listed On Document | |
| Higgs Daniel S | -- | Bonneville Superior Title Co | |
| Higgs Daniel S | -- | New World Title Insurance Ag | |
| Higgs Daniel S | -- | First American Title |
Source: Public Records
Mortgage History
| Date | Status | Borrower | Loan Amount |
|---|---|---|---|
| Previous Owner | Higgs Daniel S | $185,185 | |
| Previous Owner | Higgs Daniel S | $136,000 |
Source: Public Records
Tax History Compared to Growth
Tax History
| Year | Tax Paid | Tax Assessment Tax Assessment Total Assessment is a certain percentage of the fair market value that is determined by local assessors to be the total taxable value of land and additions on the property. | Land | Improvement |
|---|---|---|---|---|
| 2025 | $2,978 | $516,818 | $179,673 | $337,145 |
| 2024 | $2,869 | $280,186 | $98,820 | $181,366 |
| 2023 | $2,660 | $257,471 | $98,717 | $158,754 |
| 2022 | $2,832 | $278,850 | $82,207 | $196,643 |
| 2021 | $2,108 | $347,999 | $114,545 | $233,454 |
| 2020 | $2,012 | $303,999 | $79,479 | $224,520 |
| 2019 | $1,915 | $274,001 | $59,684 | $214,317 |
| 2018 | $1,716 | $235,001 | $54,648 | $180,353 |
| 2017 | $1,601 | $212,000 | $54,642 | $157,358 |
| 2016 | $1,590 | $114,890 | $28,515 | $86,375 |
| 2015 | $1,502 | $106,996 | $24,734 | $82,262 |
| 2014 | $1,477 | $102,308 | $30,148 | $72,160 |
Source: Public Records
Map
Nearby Homes
- 6014 W 5300 S
- 6036 W 4700 S
- 0 W 5500 S
- 5319 S 7100 W
- 5947 W 4600 S
- 5801 S 7100 W
- 3729 S 5600 W Unit 6
- 3720 S 5600 W Unit 2
- 3719 S 5600 W Unit 7
- 4146 S 5800 W Unit 5
- 4163 S 5800 W Unit 2
- 5752 W 2425 N
- 4100 S 5900 W
- 5335 W 5500 S
- 3632 S 5400 W
- 4879 S 5050 W
- 4111 S 5350 W
- 3706 S 5650 W Unit 9
- 3191 S 5100 St W Unit 1
- 3691 S 5600 W Unit 20