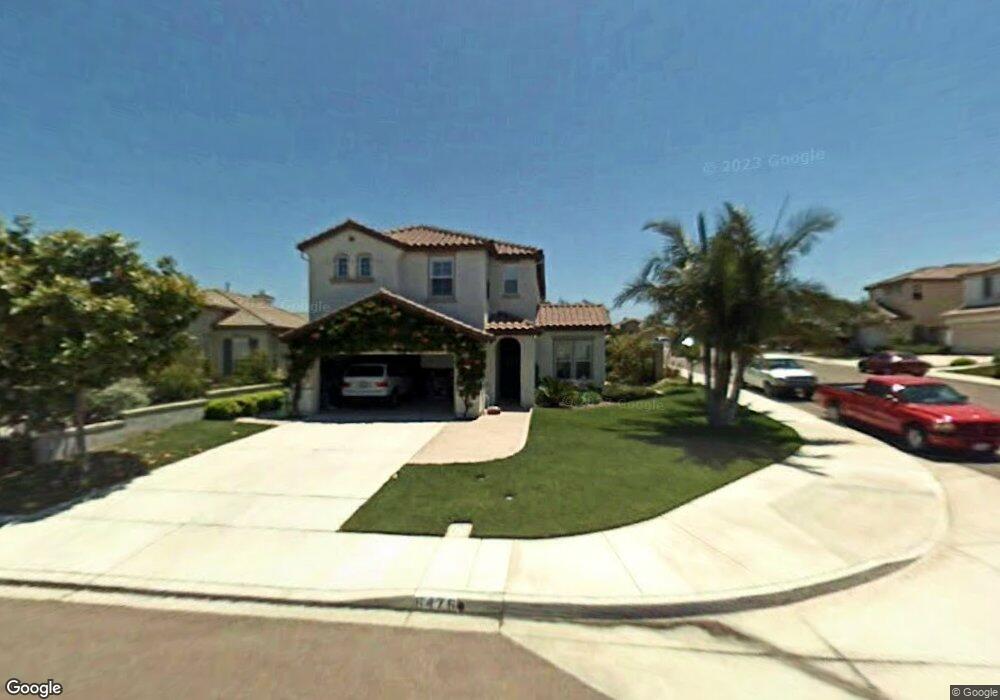
6476 Pyrus Place Unit 1 Carlsbad, CA 92011
Poinsettia NeighborhoodEstimated Value: $1,960,351 - $2,115,000
5
Beds
3
Baths
2,735
Sq Ft
$755/Sq Ft
Est. Value
About This Home
This home is located at 6476 Pyrus Place Unit 1, Carlsbad, CA 92011 and is currently estimated at $2,063,838, approximately $754 per square foot. 6476 Pyrus Place Unit 1 is a home located in San Diego County with nearby schools including Pacific Rim Elementary, Aviara Oaks Middle, and Sage Creek High.
Ownership History
Date
Name
Owned For
Owner Type
Purchase Details
Closed on
Jun 29, 2017
Sold by
Swain Wren W
Bought by
Swain Wren W
Current Estimated Value
Purchase Details
Closed on
Nov 8, 2012
Sold by
Swain Wren W
Bought by
Swain Wren W
Home Financials for this Owner
Home Financials are based on the most recent Mortgage that was taken out on this home.
Original Mortgage
$448,000
Outstanding Balance
$308,843
Interest Rate
3.34%
Mortgage Type
New Conventional
Estimated Equity
$1,754,995
Purchase Details
Closed on
Apr 12, 2010
Sold by
Swain Scott A
Bought by
Swain Wren W
Purchase Details
Closed on
Nov 9, 2001
Sold by
Standard Pacific Corp
Bought by
Swain Scott A and Swain Wren W
Home Financials for this Owner
Home Financials are based on the most recent Mortgage that was taken out on this home.
Original Mortgage
$404,550
Interest Rate
6.51%
Create a Home Valuation Report for This Property
The Home Valuation Report is an in-depth analysis detailing your home's value as well as a comparison with similar homes in the area
Home Values in the Area
Average Home Value in this Area
Purchase History
| Date | Buyer | Sale Price | Title Company |
|---|---|---|---|
| Swain Wren W | -- | None Available | |
| Swain Wren W | -- | First American Title Company | |
| Swain Wren W | -- | Accommodation | |
| Swain Scott A | $525,000 | First American Title |
Source: Public Records
Mortgage History
| Date | Status | Borrower | Loan Amount |
|---|---|---|---|
| Open | Swain Wren W | $448,000 | |
| Previous Owner | Swain Scott A | $404,550 |
Source: Public Records
Tax History
| Year | Tax Paid | Tax Assessment Tax Assessment Total Assessment is a certain percentage of the fair market value that is determined by local assessors to be the total taxable value of land and additions on the property. | Land | Improvement |
|---|---|---|---|---|
| 2025 | $8,879 | $775,562 | $443,181 | $332,381 |
| 2024 | $8,879 | $760,356 | $434,492 | $325,864 |
| 2023 | $8,837 | $745,448 | $425,973 | $319,475 |
| 2022 | $8,711 | $730,832 | $417,621 | $313,211 |
| 2021 | $8,651 | $716,503 | $409,433 | $307,070 |
| 2020 | $8,597 | $709,157 | $405,235 | $303,922 |
| 2019 | $8,455 | $695,253 | $397,290 | $297,963 |
| 2018 | $8,131 | $681,621 | $389,500 | $292,121 |
| 2017 | $92 | $668,257 | $381,863 | $286,394 |
| 2016 | $7,717 | $655,155 | $374,376 | $280,779 |
| 2015 | $7,689 | $645,315 | $368,753 | $276,562 |
| 2014 | $7,573 | $632,675 | $361,530 | $271,145 |
Source: Public Records
Map
Nearby Homes
- 907 Hickory Ct Unit 5
- 6819 Alderwood Dr
- 6677 Paseo Del Norte Unit F
- 6729 Hyacinth Cir
- 908 Caminito Madrigal Unit F
- 901 Caminito Estrada Unit C
- 948 Alyssum Rd
- 6990 Batiquitos Dr Unit 1
- 6871 Seaspray Ln
- 857 Violet Ct
- 6927 Wildrose Terrace
- 6647 Thrasher Place
- 7009 Wildrose Terrace
- 7011 Wildrose Terrace
- 6801 Embarcadero Ln
- 7104 Lantana Terrace
- 605 Seaward Ave
- 7215 Daffodil Place
- 7073 Surfbird Cir
- 6550 Ponto Dr Unit 76
- 6472 Pyrus Place Unit 1
- 6468 Pyrus Place
- 1166 Mariposa Rd Unit 1
- 1170 Mariposa Rd
- 1162 Mariposa Rd
- 6464 Pyrus Place Unit 1
- 1179 Mariposa Rd Unit 1
- 1174 Mariposa Rd Unit Tenant
- 1174 Mariposa Rd
- 1178 Mariposa Rd
- 6460 Pyrus Place
- 1183 Mariposa Rd Unit 1
- 6478 Torreyanna Cir
- 6482 Torreyanna Cir
- 1182 Mariposa Rd Unit 1
- 6474 Torreyanna Cir Unit 1
- 1254 Plum Tree Rd
- 6486 Torreyanna Cir
- 1258 Plum Tree Rd
- 6463 Pyrus Place
Your Personal Tour Guide
Ask me questions while you tour the home.