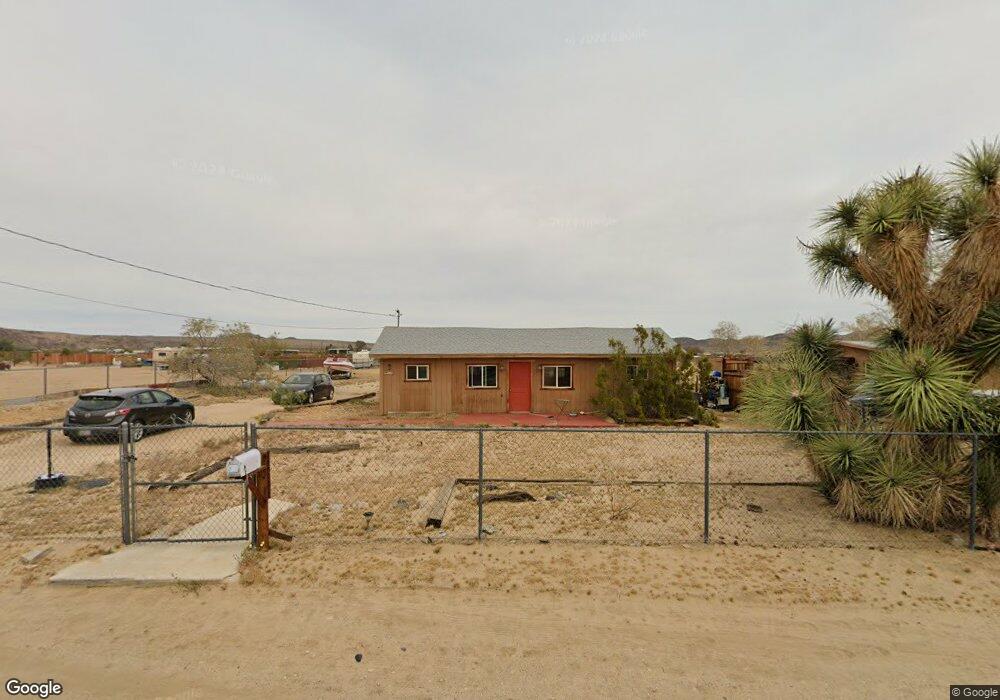
64776 Sun Mesa Rd Joshua Tree, CA 92252
Estimated Value: $222,000 - $311,000
About This Home
This home is located at 64776 Sun Mesa Rd, Joshua Tree, CA 92252 and is currently estimated at $259,502, approximately $274 per square foot. 64776 Sun Mesa Rd is a home located in San Bernardino County with nearby schools including Joshua Tree Elementary School, La Contenta Middle School, and Yucca Valley High School.
Ownership History
We collect this data history from publicly available records. To have your information removed, we recommend requesting removal directly through your county’s website.
Purchase Details
Purchase Details
Home Financials for this Owner
Home Financials are based on the most recent Mortgage that was taken out on this home.Purchase Details
Purchase Details
Purchase Details
Purchase Details
Home Values in the Area
Average Home Value in this Area
Purchase History
We collect this data history from publicly available records. To have your information removed, we recommend requesting removal directly through your county’s website.
| Date | Buyer | Sale Price | Title Company |
|---|---|---|---|
| $68,079 | Accommodation | ||
| $55,000 | Pacific Coast Title | ||
| $40,000 | Accommodation | ||
| $36,017 | -- | ||
| $45,000 | Fidelity National Title Ins | ||
| -- | -- |
Mortgage History
We collect this data history from publicly available records. To have your information removed, we recommend requesting removal directly through your county’s website.
| Date | Status | Borrower | Loan Amount |
|---|---|---|---|
| Previous Owner | $56,573 |
Tax History
We collect this data history from publicly available records. To have your information removed, we recommend requesting removal directly through your county’s website.
| Year | Tax Paid | Tax Assessment Tax Assessment Total Assessment is a certain percentage of the fair market value that is determined by local assessors to be the total taxable value of land and additions on the property. | Land | Improvement |
|---|---|---|---|---|
| 2025 | $1,191 | $71,027 | $16,573 | $54,454 |
| 2024 | $1,147 | $69,634 | $16,248 | $53,386 |
| 2023 | $1,127 | $68,268 | $15,929 | $52,339 |
| 2022 | $1,106 | $66,930 | $15,617 | $51,313 |
| 2021 | $1,093 | $65,618 | $15,311 | $50,307 |
| 2020 | $1,083 | $64,945 | $15,154 | $49,791 |
| 2019 | $1,128 | $63,672 | $14,857 | $48,815 |
| 2018 | $961 | $62,424 | $14,566 | $47,858 |
| 2017 | $953 | $61,200 | $14,280 | $46,920 |
| 2016 | $939 | $59,974 | $10,905 | $49,069 |
| 2015 | $923 | $59,073 | $10,741 | $48,332 |
| 2014 | $924 | $57,916 | $10,531 | $47,385 |
Map
- 64722 Sun Mesa Rd
- 0 Sun Oro Rd Unit JT26038266
- 0 1st St W
- 64754 E Broadway
- 4700 Sun Oro Rd
- 64916 E Broadway
- 4920 1st St E
- 65076 E Broadway
- 4966 1st St E
- 5059 1st St W
- 64868 Tonto Dr
- 2 Sun Loma Rd
- 0 Sunflower Rd Unit JT26013960
- 403 Sun Beam Ave
- 0 4th St S Unit OC25122985
- 0 4th St S Unit 27168771
- 63974 Sun Mesa Rd
- 65650 Sun Mesa Rd
- 64475 Sun Mesa Rd
- 0 Reagan Rd Unit JT26108010
- 64754 Sun Mesa Rd
- 64755 Sun Mesa Rd
- 64815 Sun Mesa Rd
- 64845 Sun Mesa Rd
- 4715 Sun Ray Rd
- 64822 Sun Mesa Rd
- 64784 Sonora Rd
- 64784 Sun Oro Rd
- 64676 Sun Mesa Rd
- 64828 Sun Mesa Rd Unit ORO
- 64724 Sonora Rd
- 4732 Sun Ray Rd
- 64816 Sun Oro Rd
- 64828 Sun Oro Rd
- 64840 Sun Oro Rd
- 4714 Sunfair Rd
- 64724 Sun Oro Rd
- 64654 Sun Mesa Rd
- 64645 Sun Mesa Rd
- 64721 Sunflower Rd
Ask me questions while you tour the home.