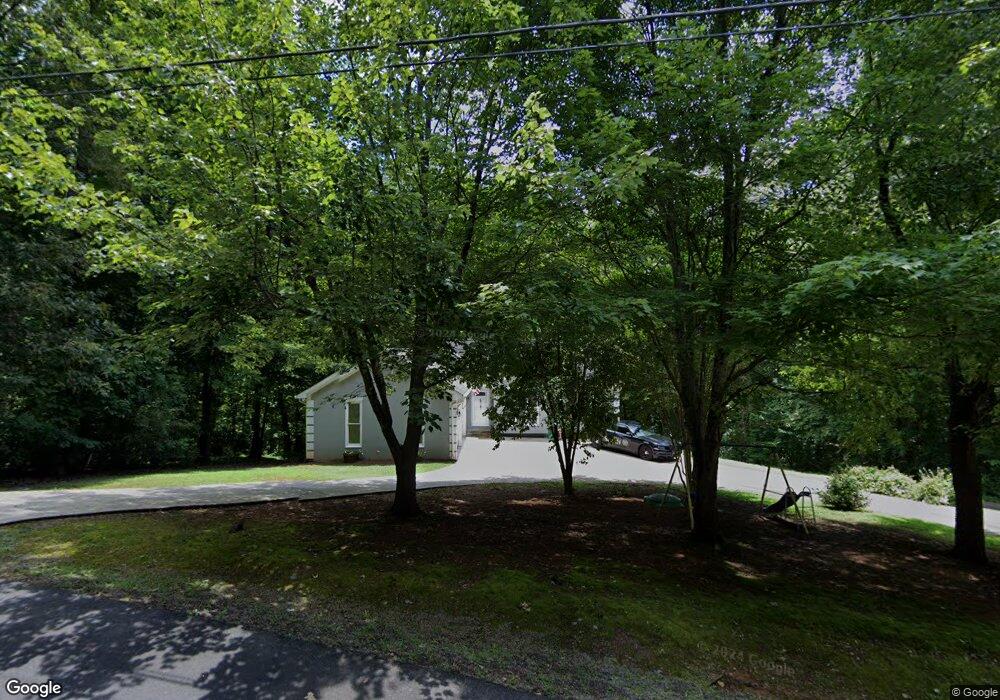
648 Scenic View Dr Jasper, GA 30143
Estimated Value: $137,000 - $375,000
--
Bed
2
Baths
1,444
Sq Ft
$197/Sq Ft
Est. Value
About This Home
This home is located at 648 Scenic View Dr, Jasper, GA 30143 and is currently estimated at $284,157, approximately $196 per square foot. 648 Scenic View Dr is a home located in Pickens County with nearby schools including Harmony Elementary School, Pickens County Middle School, and Pickens County High School.
Ownership History
Date
Name
Owned For
Owner Type
Purchase Details
Closed on
Jul 31, 2016
Sold by
Carolyn T
Bought by
Cantrell Jimmy Terrell
Current Estimated Value
Purchase Details
Closed on
Sep 5, 2014
Sold by
Davidson Nora Louise
Bought by
Davidson Nora Louise and Cantrell Carolyn T
Purchase Details
Closed on
Sep 25, 1997
Sold by
Eaton Robert C
Bought by
Davidson Raymond Eug
Purchase Details
Closed on
Apr 22, 1996
Bought by
Eaton Robert C
Purchase Details
Closed on
Jun 27, 1994
Sold by
Buchanan David
Bought by
Buchanan David and Buchanan Suzanne
Purchase Details
Closed on
May 4, 1994
Sold by
Spence Donald
Bought by
Buchanan David
Purchase Details
Closed on
Feb 17, 1987
Sold by
Carver Carver and Carver Mullins
Bought by
Spence Donald
Purchase Details
Closed on
Oct 30, 1984
Bought by
Carver Carver and Carver Mullins
Create a Home Valuation Report for This Property
The Home Valuation Report is an in-depth analysis detailing your home's value as well as a comparison with similar homes in the area
Home Values in the Area
Average Home Value in this Area
Purchase History
| Date | Buyer | Sale Price | Title Company |
|---|---|---|---|
| Cantrell Jimmy Terrell | -- | -- | |
| Davidson Nora Louise | -- | -- | |
| Davidson Raymond Eug | $110,000 | -- | |
| Eaton Robert C | $87,000 | -- | |
| Buchanan David | -- | -- | |
| Buchanan David | $5,300 | -- | |
| Spence Donald | $3,800 | -- | |
| Carver Carver | -- | -- |
Source: Public Records
Tax History Compared to Growth
Tax History
| Year | Tax Paid | Tax Assessment Tax Assessment Total Assessment is a certain percentage of the fair market value that is determined by local assessors to be the total taxable value of land and additions on the property. | Land | Improvement |
|---|---|---|---|---|
| 2024 | $950 | $48,020 | $6,155 | $41,865 |
| 2023 | $977 | $48,020 | $6,155 | $41,865 |
| 2022 | $977 | $48,020 | $6,155 | $41,865 |
| 2021 | $1,046 | $48,020 | $6,155 | $41,865 |
| 2020 | $1,078 | $48,020 | $6,155 | $41,865 |
| 2019 | $1,102 | $48,020 | $6,155 | $41,865 |
| 2018 | $1,113 | $48,020 | $6,155 | $41,865 |
| 2017 | $1,131 | $48,020 | $6,155 | $41,865 |
| 2016 | $944 | $47,783 | $5,918 | $41,865 |
| 2015 | $917 | $47,783 | $5,918 | $41,865 |
| 2014 | $917 | $47,783 | $5,918 | $41,865 |
| 2013 | -- | $47,783 | $5,918 | $41,864 |
Source: Public Records
Map
Nearby Homes
- 59 Brittany Ct
- 59 Brittany Ct Unit 8
- 0 Wildlife Ridge Rd Unit 7650854
- 0 Wildlife Ridge Rd Unit 10606699
- 264 E Boling Rd
- 41 Clark Station Rd
- 155 Crossroad Cir
- 71 Emerald Ln
- 3.11 Acres Cove Rd
- 1003 E Church St
- 981 E Church St
- 3.11 AC Cove Rd
- 5 Towne Villas Dr
- 57 Towne Club Dr
- 157 Towne Villas Dr Unit 18
- 165 Towne Villas Dr Unit 20
- 0 Grandview Rd Unit 10623952
- 0 Grandview Rd Unit 7664297
- 787 Cove Rd
- 960 S Main St
- 718 Scenic View Dr
- 612 Scenic View Dr
- 51 Twin Oaks Cir
- 7 Twin Oaks Cir
- 701 Scenic View Dr
- 679 Scenic View Dr
- 115 Twin Oaks Cir
- 0 Twin Oaks Cir Unit 8327467
- 0 Twin Oaks Cir
- 2868 Twin Oaks Cir
- 576 Scenic View Dr
- 455 Scenic View Dr
- 834 Scenic View Dr
- 92 Twin Oaks Cir
- 121 Twin Oaks Cir
- 561 Scenic View Dr
- 425 Drop Shot Dr
- 319 Scenic View Dr
- 292 Scenic View Dr
- 2068 Highway 53 E