649 18th St Des Moines, IA 50314
Sherman Hill NeighborhoodEstimated Value: $345,679 - $370,000
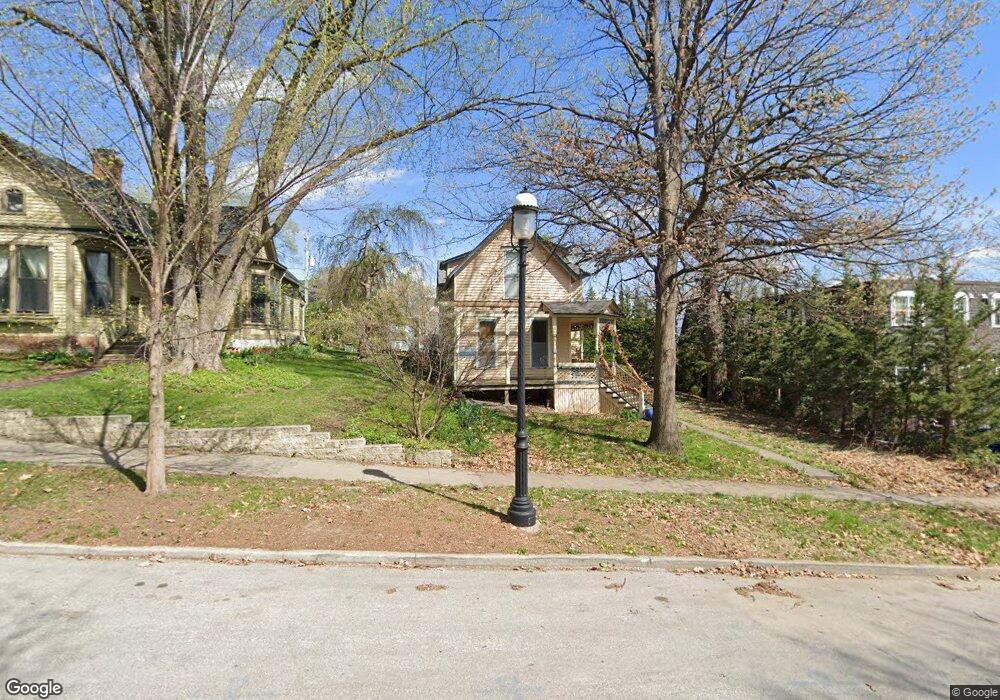
About This Home
This home is located at 649 18th St, Des Moines, IA 50314 and is currently estimated at $357,420, approximately $149 per square foot. 649 18th St is a home located in Polk County with nearby schools including Callanan Middle School and Roosevelt High School.
Ownership History
We collect this data history from publicly available records. To have your information removed, we recommend requesting removal directly through your county’s website.
Purchase Details
Purchase Details
Purchase Details
Home Values in the Area
Average Home Value in this Area
Purchase History
We collect this data history from publicly available records. To have your information removed, we recommend requesting removal directly through your county’s website.
| Date | Buyer | Sale Price | Title Company |
|---|---|---|---|
| -- | Attorney | ||
| $109,500 | None Available | ||
| -- | None Available |
Tax History
We collect this data history from publicly available records. To have your information removed, we recommend requesting removal directly through your county’s website.
| Year | Tax Paid | Tax Assessment Tax Assessment Total Assessment is a certain percentage of the fair market value that is determined by local assessors to be the total taxable value of land and additions on the property. | Land | Improvement |
|---|---|---|---|---|
| 2025 | $5,716 | $326,600 | $58,800 | $267,800 |
| 2024 | $5,716 | $291,100 | $52,200 | $238,900 |
| 2023 | $5,288 | $291,100 | $52,200 | $238,900 |
| 2022 | $5,246 | $225,700 | $42,300 | $183,400 |
| 2021 | $5,028 | $225,700 | $42,300 | $183,400 |
| 2020 | $5,208 | $203,500 | $38,400 | $165,100 |
| 2019 | $4,968 | $203,500 | $38,400 | $165,100 |
| 2018 | $4,910 | $187,700 | $34,600 | $153,100 |
| 2017 | $4,682 | $187,700 | $34,600 | $153,100 |
| 2016 | $4,556 | $176,300 | $31,800 | $144,500 |
| 2015 | $4,556 | $176,300 | $31,800 | $144,500 |
| 2014 | $4,520 | $173,600 | $30,900 | $142,700 |
Map
- 1802 Woodland Ave
- 1728 Woodland Ave
- 1804 Woodland Ave
- 1726 Woodland Ave
- 1808 Woodland Ave
- 1720 Woodland Ave
- 1731 High St
- 1818 Woodland Ave
- 1815 High St
- 1716 Woodland Ave
- 650 18th St
- 641 19th St Unit 7
- 641 19th St
- 1706 Woodland Ave
- 611 19th St
- 1821 High St
- 1821 Woodland Ave
- 1823 High St
- 655 18th St
- 1701 Woodland Ave
Ask me questions while you tour the home.