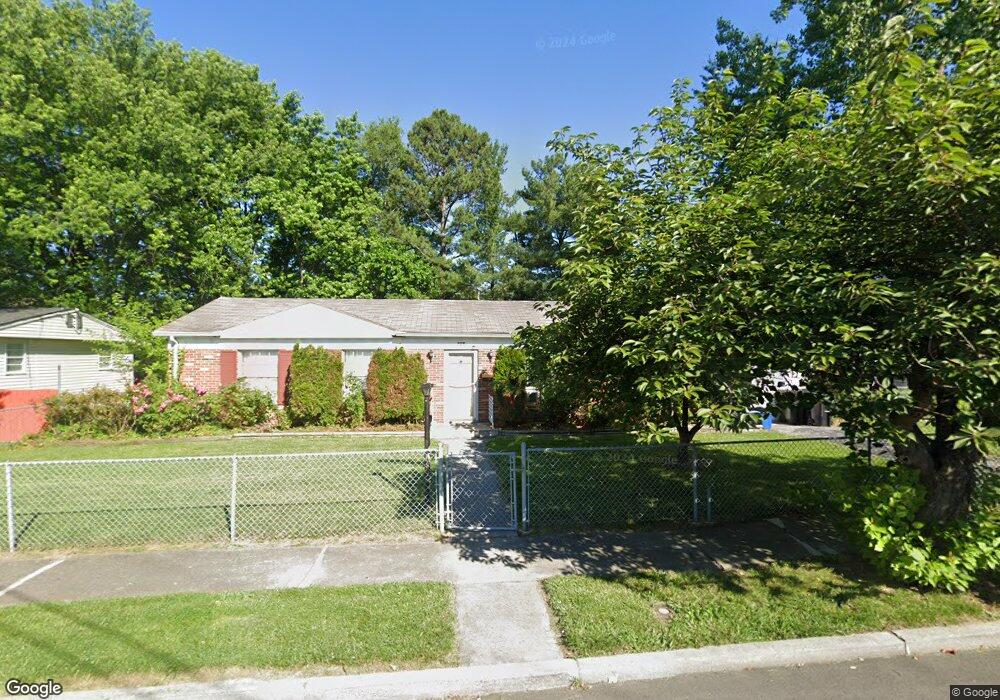
649 Fairview Ave Winchester, VA 22601
Estimated Value: $313,000 - $342,000
3
Beds
3
Baths
1,522
Sq Ft
$215/Sq Ft
Est. Value
About This Home
This home is located at 649 Fairview Ave, Winchester, VA 22601 and is currently estimated at $326,684, approximately $214 per square foot. 649 Fairview Ave is a home located in Winchester City with nearby schools including Virginia Avenue Charlotte Dehart Elementary School, Daniel Morgan Middle School, and John Handley High School.
Ownership History
Date
Name
Owned For
Owner Type
Purchase Details
Closed on
Oct 10, 2018
Sold by
Park Chan and Park Tony
Bought by
Park Gi Hwa
Current Estimated Value
Purchase Details
Closed on
Dec 1, 2016
Sold by
Kwak Soon Yeon and Kwak Soo Yeon
Bought by
Park Chan
Purchase Details
Closed on
Apr 27, 2009
Sold by
Park Gi Hwa
Bought by
Cascade Management Inc
Purchase Details
Closed on
Apr 21, 2009
Sold by
Citibank Na
Bought by
Park Gi Hwa
Purchase Details
Closed on
May 15, 2008
Sold by
Carter Morris
Bought by
Citibank Na
Purchase Details
Closed on
Jan 25, 2007
Sold by
Molden Real Estate Corporation
Bought by
Carter Morris M
Home Financials for this Owner
Home Financials are based on the most recent Mortgage that was taken out on this home.
Original Mortgage
$219,200
Interest Rate
8.99%
Mortgage Type
Adjustable Rate Mortgage/ARM
Create a Home Valuation Report for This Property
The Home Valuation Report is an in-depth analysis detailing your home's value as well as a comparison with similar homes in the area
Home Values in the Area
Average Home Value in this Area
Purchase History
| Date | Buyer | Sale Price | Title Company |
|---|---|---|---|
| Park Gi Hwa | -- | None Available | |
| Park Chan | -- | Chicago Title | |
| Cascade Management Inc | -- | None Available | |
| Park Gi Hwa | $80,000 | None Available | |
| Citibank Na | $228,000 | None Available | |
| Carter Morris M | -- | Freedom Title Services |
Source: Public Records
Mortgage History
| Date | Status | Borrower | Loan Amount |
|---|---|---|---|
| Previous Owner | Carter Morris M | $219,200 |
Source: Public Records
Tax History Compared to Growth
Tax History
| Year | Tax Paid | Tax Assessment Tax Assessment Total Assessment is a certain percentage of the fair market value that is determined by local assessors to be the total taxable value of land and additions on the property. | Land | Improvement |
|---|---|---|---|---|
| 2025 | $2,316 | $291,300 | $65,000 | $226,300 |
| 2024 | $2,165 | $260,900 | $65,000 | $195,900 |
| 2023 | $2,165 | $260,900 | $65,000 | $195,900 |
| 2022 | $1,801 | $193,700 | $65,000 | $128,700 |
| 2021 | $1,801 | $193,700 | $65,000 | $128,700 |
| 2020 | $1,742 | $187,300 | $65,000 | $122,300 |
| 2019 | $1,742 | $187,300 | $65,000 | $122,300 |
| 2018 | $1,645 | $180,800 | $65,000 | $115,800 |
| 2017 | $1,645 | $180,800 | $65,000 | $115,800 |
| 2016 | $1,529 | $168,000 | $65,000 | $103,000 |
| 2015 | $1,529 | $168,000 | $65,000 | $103,000 |
| 2014 | $1,294 | $148,300 | $70,000 | $78,300 |
Source: Public Records
Map
Nearby Homes
- 290 Green St
- 621 Butler Ave
- 700 Watson Ave
- 505 Green St
- 301 Liberty Ave
- 553 Highland Ave
- 513 van Fossen St
- 520 Highland Ave
- 608 Green St
- 613 Laurelwood Cir
- 852 Butler Ave
- 320 Highland Ave
- 369 Charles St
- 510 N Loudoun St
- 580 N Braddock St
- 117 Boone Ct
- 715 Berryville Ave
- 501 National Ave
- 723 Berryville Ave
- 26 A Jackson Ave