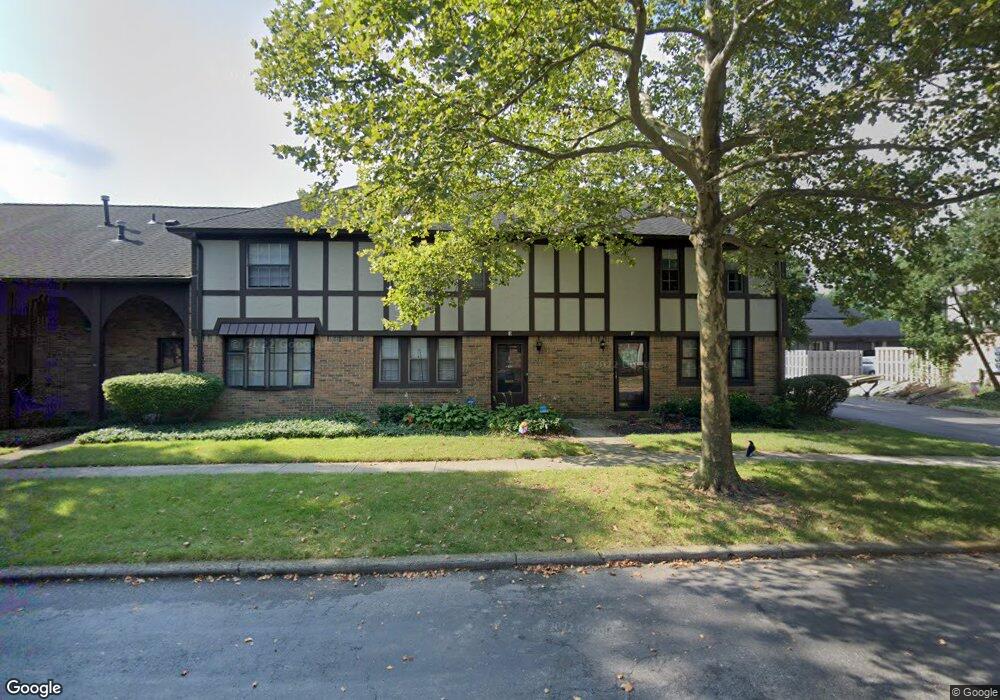
649 Olde Towne Ave Unit 649D Columbus, OH 43214
Olentangy Commons NeighborhoodEstimated Value: $215,627 - $251,000
2
Beds
2
Baths
1,283
Sq Ft
$177/Sq Ft
Est. Value
About This Home
This home is located at 649 Olde Towne Ave Unit 649D, Columbus, OH 43214 and is currently estimated at $227,657, approximately $177 per square foot. 649 Olde Towne Ave Unit 649D is a home located in Franklin County with nearby schools including Winterset Elementary School, Ridgeview Middle School, and Centennial High School.
Ownership History
Date
Name
Owned For
Owner Type
Purchase Details
Closed on
Dec 9, 2010
Sold by
Murphy Michael H and Murphy Julie E
Bought by
Smith Gary L and Smith Denise A
Current Estimated Value
Purchase Details
Closed on
Apr 7, 2004
Sold by
Krucky Elizabeth A and Houston Ryan
Bought by
Murphy Michael H and Murphy Julie E
Purchase Details
Closed on
Aug 8, 2002
Sold by
Krucky Elizabeth A
Bought by
Krucky Elizabeth A and Houston Ryan
Home Financials for this Owner
Home Financials are based on the most recent Mortgage that was taken out on this home.
Original Mortgage
$72,000
Interest Rate
6.63%
Purchase Details
Closed on
Sep 28, 1993
Bought by
Krucky Elizabeth A
Purchase Details
Closed on
Jul 15, 1993
Purchase Details
Closed on
Dec 1, 1983
Create a Home Valuation Report for This Property
The Home Valuation Report is an in-depth analysis detailing your home's value as well as a comparison with similar homes in the area
Home Values in the Area
Average Home Value in this Area
Purchase History
| Date | Buyer | Sale Price | Title Company |
|---|---|---|---|
| Smith Gary L | $82,500 | Fati | |
| Murphy Michael H | $97,000 | Chicago Title | |
| Krucky Elizabeth A | -- | Midland Celtic Title | |
| Krucky Elizabeth A | -- | -- | |
| -- | $57,300 | -- | |
| -- | $53,700 | -- |
Source: Public Records
Mortgage History
| Date | Status | Borrower | Loan Amount |
|---|---|---|---|
| Previous Owner | Krucky Elizabeth A | $72,000 |
Source: Public Records
Tax History Compared to Growth
Tax History
| Year | Tax Paid | Tax Assessment Tax Assessment Total Assessment is a certain percentage of the fair market value that is determined by local assessors to be the total taxable value of land and additions on the property. | Land | Improvement |
|---|---|---|---|---|
| 2024 | $2,419 | $52,780 | $14,000 | $38,780 |
| 2023 | $2,389 | $52,780 | $14,000 | $38,780 |
| 2022 | $2,102 | $39,560 | $5,710 | $33,850 |
| 2021 | $2,106 | $39,560 | $5,710 | $33,850 |
| 2020 | $2,109 | $39,560 | $5,710 | $33,850 |
| 2019 | $1,892 | $30,420 | $4,380 | $26,040 |
| 2018 | $1,736 | $30,420 | $4,380 | $26,040 |
| 2017 | $1,891 | $30,420 | $4,380 | $26,040 |
| 2016 | $1,739 | $25,590 | $5,600 | $19,990 |
| 2015 | $1,583 | $25,590 | $5,600 | $19,990 |
| 2014 | $1,587 | $25,590 | $5,600 | $19,990 |
| 2013 | $869 | $28,420 | $6,230 | $22,190 |
Source: Public Records
Map
Nearby Homes
- 652 Olde Towne Ave Unit 9-652E
- 652 Olde Towne Ave Unit 9-652 G
- 1030 Galliton Ct Unit B
- 325 Starrett Ct
- 1046 Merrimar Cir N Unit B
- 4994 Delawanda Ave
- 4466 Olentangy Blvd
- 238 W Henderson Rd
- 4710 Charecote Ln Unit D
- 202 Rathbone Ave
- 1161 Bethel Rd Unit 103/104
- 1033 Folkestone Rd
- 5200 Fenway Ct Unit A
- 287 Fenway Rd Unit B
- 4 W Royal Forest Blvd
- 1221 Bethel Rd
- 148 Deland Ave
- 49 W Henderson Rd
- 511 W Kanawha Ave
- 895 Linworth Village Dr
- 649 Olde Towne Ave
- 649 Olde Towne Ave Unit 649A
- 649 Olde Towne Ave
- 649 Olde Towne Ave
- 649 Olde Towne Ave Unit 649E
- 649 Olde Towne Ave Unit E
- 649 Olde Towne Ave Unit 17-649
- 649 Olde Towne Ave Unit D
- 649 Olde Towne Ave Unit A
- 649 Olde Towne Ave Unit F
- 4765 Middletowne St Unit B
- 4765 Middletowne St Unit E
- 4765 Middletowne St Unit C
- 4765 Middletowne St Unit D
- 4765 Middletowne St Unit F
- 4765 Middletowne St Unit G
- 4765 Middletowne St Unit A
- 4765 Middletowne St Unit 14-476
- 4765 Middletowne St
- 652 Olde Towne Ave