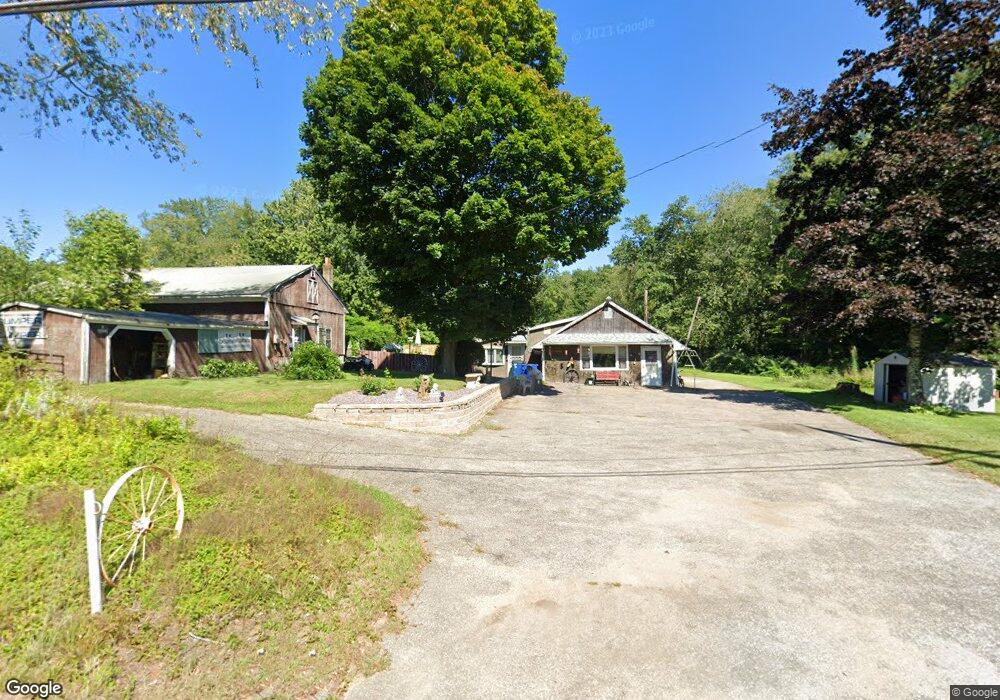
649 Podunk Rd East Brookfield, MA 01515
Estimated Value: $360,194 - $513,000
3
Beds
2
Baths
1,342
Sq Ft
$311/Sq Ft
Est. Value
About This Home
This home is located at 649 Podunk Rd, East Brookfield, MA 01515 and is currently estimated at $417,049, approximately $310 per square foot. 649 Podunk Rd is a home located in Worcester County with nearby schools including David Prouty High School.
Ownership History
Date
Name
Owned For
Owner Type
Purchase Details
Closed on
Apr 20, 2017
Sold by
Shannon Patricia A
Bought by
Shannon Daniel W and Shannon Jessica A
Current Estimated Value
Purchase Details
Closed on
Jun 26, 2015
Sold by
Constantineau Ann M
Bought by
Shannon Daniel W and Shannon Jessica A
Purchase Details
Closed on
Dec 6, 1984
Bought by
Constantineau Roland M
Create a Home Valuation Report for This Property
The Home Valuation Report is an in-depth analysis detailing your home's value as well as a comparison with similar homes in the area
Home Values in the Area
Average Home Value in this Area
Purchase History
| Date | Buyer | Sale Price | Title Company |
|---|---|---|---|
| Shannon Daniel W | $20,000 | -- | |
| Shannon Daniel W | -- | -- | |
| Constantineau Roland M | -- | -- |
Source: Public Records
Tax History Compared to Growth
Tax History
| Year | Tax Paid | Tax Assessment Tax Assessment Total Assessment is a certain percentage of the fair market value that is determined by local assessors to be the total taxable value of land and additions on the property. | Land | Improvement |
|---|---|---|---|---|
| 2025 | $3,656 | $284,700 | $78,100 | $206,600 |
| 2024 | $3,089 | $241,900 | $71,600 | $170,300 |
| 2023 | $3,091 | $235,800 | $65,500 | $170,300 |
| 2022 | $3,006 | $222,200 | $57,200 | $165,000 |
| 2021 | $2,960 | $199,600 | $57,500 | $142,100 |
| 2020 | $2,829 | $190,900 | $57,500 | $133,400 |
| 2019 | $2,965 | $180,000 | $57,500 | $122,500 |
| 2018 | $2,647 | $171,200 | $57,500 | $113,700 |
| 2017 | $2,582 | $158,600 | $53,200 | $105,400 |
| 2016 | $2,605 | $149,200 | $53,200 | $96,000 |
| 2015 | $2,590 | $149,200 | $53,200 | $96,000 |
| 2014 | $2,599 | $149,200 | $53,200 | $96,000 |
Source: Public Records
Map
Nearby Homes
- 145 Draper Rd
- 172 Stone Rd
- 86 Jolicoeur Ave
- 9 Hebert Rd
- 3 Cranberry Meadow Shore Rd
- 100 Rice Rd
- 49 Jennings Rd
- Lot 0 N Sturbridge Rd
- 45 Jennings Rd
- 216 Brookfield Rd
- 70 Quaboag St
- 204 Brookfield Rd
- 1 Lane 22
- 132 Lane 9
- 31 Lyford Rd
- 208 Sunset Dr
- Lot 3 0 N Sullivan Rd
- Lot 6 0 N Sullivan Rd
- Lot 5 0 N Sullivan Rd
- Lot 4 0 N Sullivan Rd