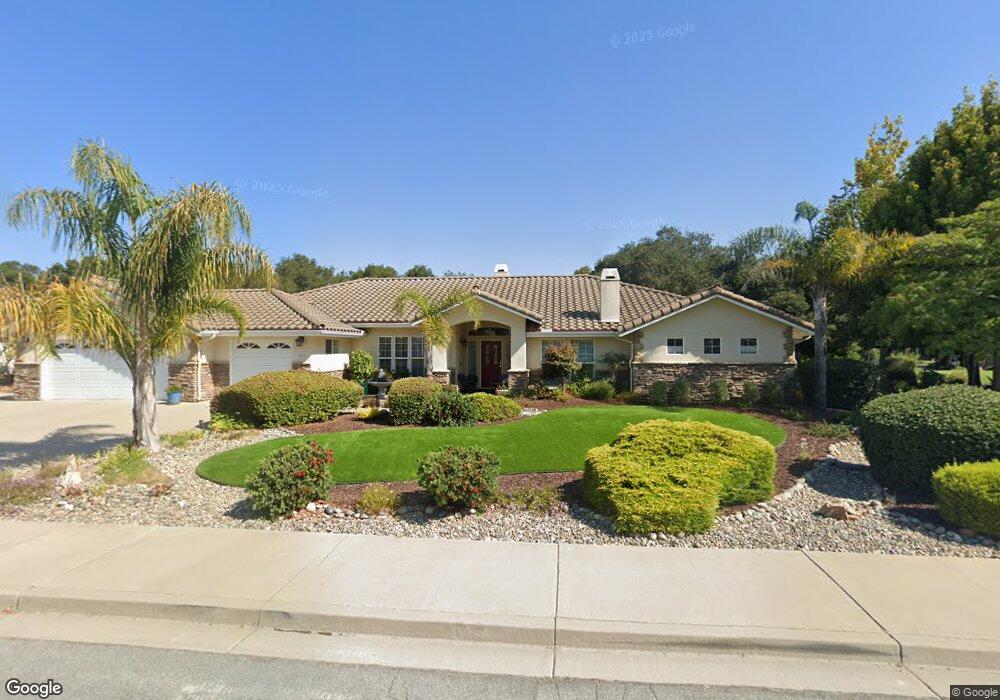
649 Shelter Ridge Place Nipomo, CA 93444
Blacklake NeighborhoodEstimated Value: $1,141,000 - $1,243,000
4
Beds
4
Baths
2,767
Sq Ft
$438/Sq Ft
Est. Value
About This Home
This home is located at 649 Shelter Ridge Place, Nipomo, CA 93444 and is currently estimated at $1,210,919, approximately $437 per square foot. 649 Shelter Ridge Place is a home located in San Luis Obispo County with nearby schools including Dorothea Lange Elementary School, Mesa Middle School, and Nipomo High School.
Ownership History
Date
Name
Owned For
Owner Type
Purchase Details
Closed on
Sep 16, 2022
Sold by
Wright William W and Lynn Nanette
Bought by
William And Nanette Wright Revocable Family T
Current Estimated Value
Purchase Details
Closed on
Apr 20, 2009
Sold by
Wright William W and Wright Nanette Lynn
Bought by
Wright William W and Wright Nannette Lynn
Home Financials for this Owner
Home Financials are based on the most recent Mortgage that was taken out on this home.
Original Mortgage
$175,010
Interest Rate
4.82%
Mortgage Type
New Conventional
Purchase Details
Closed on
Apr 29, 1999
Sold by
Charles A Pratt Construction Co Inc
Bought by
Wright William W and Wright Nanette Lynn
Home Financials for this Owner
Home Financials are based on the most recent Mortgage that was taken out on this home.
Original Mortgage
$150,000
Interest Rate
7.84%
Create a Home Valuation Report for This Property
The Home Valuation Report is an in-depth analysis detailing your home's value as well as a comparison with similar homes in the area
Home Values in the Area
Average Home Value in this Area
Purchase History
| Date | Buyer | Sale Price | Title Company |
|---|---|---|---|
| William And Nanette Wright Revocable Family T | -- | -- | |
| Wright William W | -- | First American Title Company | |
| Wright William W | $366,500 | First American Title |
Source: Public Records
Mortgage History
| Date | Status | Borrower | Loan Amount |
|---|---|---|---|
| Previous Owner | Wright William W | $175,010 | |
| Previous Owner | Wright William W | $150,000 |
Source: Public Records
Tax History Compared to Growth
Tax History
| Year | Tax Paid | Tax Assessment Tax Assessment Total Assessment is a certain percentage of the fair market value that is determined by local assessors to be the total taxable value of land and additions on the property. | Land | Improvement |
|---|---|---|---|---|
| 2025 | $6,908 | $563,278 | $230,533 | $332,745 |
| 2024 | $6,849 | $552,234 | $226,013 | $326,221 |
| 2023 | $6,849 | $541,407 | $221,582 | $319,825 |
| 2022 | $6,773 | $530,792 | $217,238 | $313,554 |
| 2021 | $5,607 | $520,385 | $212,979 | $307,406 |
| 2020 | $5,543 | $515,050 | $210,796 | $304,254 |
| 2019 | $5,508 | $504,952 | $206,663 | $298,289 |
| 2018 | $5,441 | $495,052 | $202,611 | $292,441 |
| 2017 | $5,333 | $485,346 | $198,639 | $286,707 |
| 2016 | $5,031 | $475,831 | $194,745 | $281,086 |
| 2015 | $4,958 | $468,684 | $191,820 | $276,864 |
| 2014 | $4,774 | $459,504 | $188,063 | $271,441 |
Source: Public Records
Map
Nearby Homes
- 1150 Redberry Place
- 639 Barberry Way
- 1337 Black Sage Cir
- 1060 Dawn Rd
- 1225 Dawn Rd
- 1276 Pomeroy Rd
- 940 Calle Fresa
- 1024 Maggie Ln
- 1354 Trail View Place
- 462 Camino Perillo
- 1084 Emma Ln
- 961 Jacqueline Place
- 977 Jacqueline Place
- 1441 Vicki Ln
- 1255 Viva Way
- 1539 Vista Tesoro Place
- 808 Albert Way
- 708 Albert Way
- 1010 1012 Upper Los Berros Rd
- 1147 Vaquero Way
- 641 Shelter Ridge Place
- 655 Shelter Ridge Place
- 644 Shelter Ridge Place
- 650 Shelter Ridge Place
- 640 Shelter Ridge Place
- 661 Shelter Ridge Place
- 1170 Redberry Place
- 625 Shelter Ridge Place
- 1180 Redberry Place
- 638 Shelter Ridge Place
- 1160 Redberry Place
- 1190 Redberry Place
- 617 Shelter Ridge Place
- 665 Shelter Ridge Place
- 679 Shelter Ridge Place
- 680 Shelter Ridge Place
- 626 Shelter Ridge Place
- 673 Shelter Ridge Place
- 611 Shelter Ridge Place
- 1140 Redberry Place