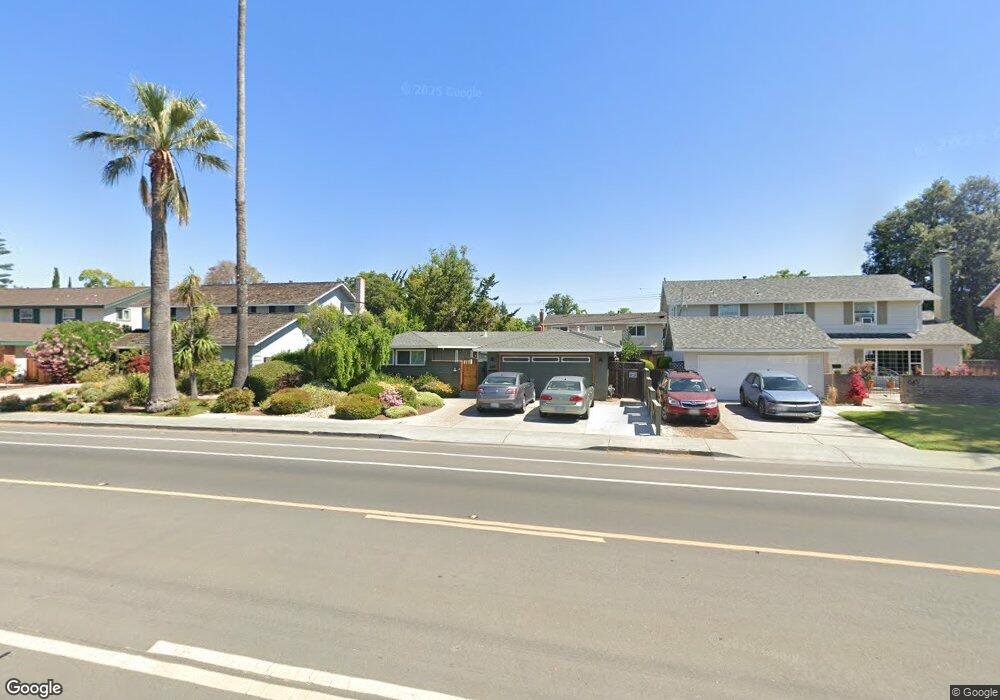
649 W Remington Dr Sunnyvale, CA 94087
Estimated Value: $2,540,000 - $2,821,000
3
Beds
2
Baths
1,699
Sq Ft
$1,565/Sq Ft
Est. Value
About This Home
This home is located at 649 W Remington Dr, Sunnyvale, CA 94087 and is currently estimated at $2,658,752, approximately $1,564 per square foot. 649 W Remington Dr is a home located in Santa Clara County with nearby schools including Cumberland Elementary School, Sunnyvale Middle School, and Fremont High School.
Ownership History
Date
Name
Owned For
Owner Type
Purchase Details
Closed on
Feb 29, 2016
Sold by
Nahial John
Bought by
Bourne Jeanine M
Current Estimated Value
Home Financials for this Owner
Home Financials are based on the most recent Mortgage that was taken out on this home.
Original Mortgage
$300,000
Interest Rate
3.81%
Mortgage Type
New Conventional
Purchase Details
Closed on
Sep 5, 2013
Sold by
Bourne Jeanine M
Bought by
Bourne Jeanine M
Home Financials for this Owner
Home Financials are based on the most recent Mortgage that was taken out on this home.
Original Mortgage
$200,000
Interest Rate
3.99%
Mortgage Type
Credit Line Revolving
Purchase Details
Closed on
Jul 17, 2009
Sold by
Bourne Robert K and Bourne Mary Lynne
Bought by
Bourne Jeanine M
Create a Home Valuation Report for This Property
The Home Valuation Report is an in-depth analysis detailing your home's value as well as a comparison with similar homes in the area
Home Values in the Area
Average Home Value in this Area
Purchase History
| Date | Buyer | Sale Price | Title Company |
|---|---|---|---|
| Bourne Jeanine M | -- | Fidelity National Title Co | |
| Bourne Jeanine M | -- | Chicago Title Company | |
| Bourne Jeanine M | -- | None Available |
Source: Public Records
Mortgage History
| Date | Status | Borrower | Loan Amount |
|---|---|---|---|
| Closed | Bourne Jeanine M | $300,000 | |
| Closed | Bourne Jeanine M | $200,000 |
Source: Public Records
Tax History Compared to Growth
Tax History
| Year | Tax Paid | Tax Assessment Tax Assessment Total Assessment is a certain percentage of the fair market value that is determined by local assessors to be the total taxable value of land and additions on the property. | Land | Improvement |
|---|---|---|---|---|
| 2025 | $1,734 | $137,165 | $38,085 | $99,080 |
| 2024 | $1,734 | $134,477 | $37,339 | $97,138 |
| 2023 | $1,713 | $131,841 | $36,607 | $95,234 |
| 2022 | $1,687 | $129,257 | $35,890 | $93,367 |
| 2021 | $1,668 | $126,724 | $35,187 | $91,537 |
| 2020 | $1,646 | $125,426 | $34,827 | $90,599 |
| 2019 | $1,614 | $122,968 | $34,145 | $88,823 |
| 2018 | $1,583 | $120,558 | $33,476 | $87,082 |
| 2017 | $1,562 | $118,195 | $32,820 | $85,375 |
| 2016 | $1,494 | $115,878 | $32,177 | $83,701 |
| 2015 | $1,498 | $114,138 | $31,694 | $82,444 |
| 2014 | $1,471 | $111,904 | $31,074 | $80,830 |
Source: Public Records
Map
Nearby Homes
- 654 Princeton Dr
- 128 Brahms Way
- 839 Springfield Terrace
- 1262 Riesling Terrace
- 745 Reseda Dr
- 541 Holthouse Terrace
- 1243 E Fremont Terrace
- 857 Peach Ave
- 960 Heatherstone Ave
- 1308 Yarmouth Terrace
- Plan 7 at Vida
- Plan 4 at Vida
- Plan 2 at Vida
- Plan 8 at Vida
- Plan 1 at Vida
- Plan 3 at Vida
- Plan 5 at Vida
- Plan 6 at Vida
- 1304 Barbet Cir Unit 6
- 1304 Barbet Cir Unit 1
- 645 W Remington Dr
- 653 W Remington Dr
- 646 Princeton Dr
- 650 Princeton Dr
- 657 W Remington Dr
- 642 Princeton Dr
- 638 Princeton Dr
- 661 W Remington Dr
- 658 Princeton Dr
- 654 W Remington Dr
- 637 W Remington Dr
- 658 W Remington Dr
- 648 W Remington Dr
- 634 Princeton Dr
- 662 Princeton Dr
- 665 W Remington Dr
- 662 W Remington Dr
- 644 W Remington Dr
- 643 Princeton Dr
- 639 Princeton Dr