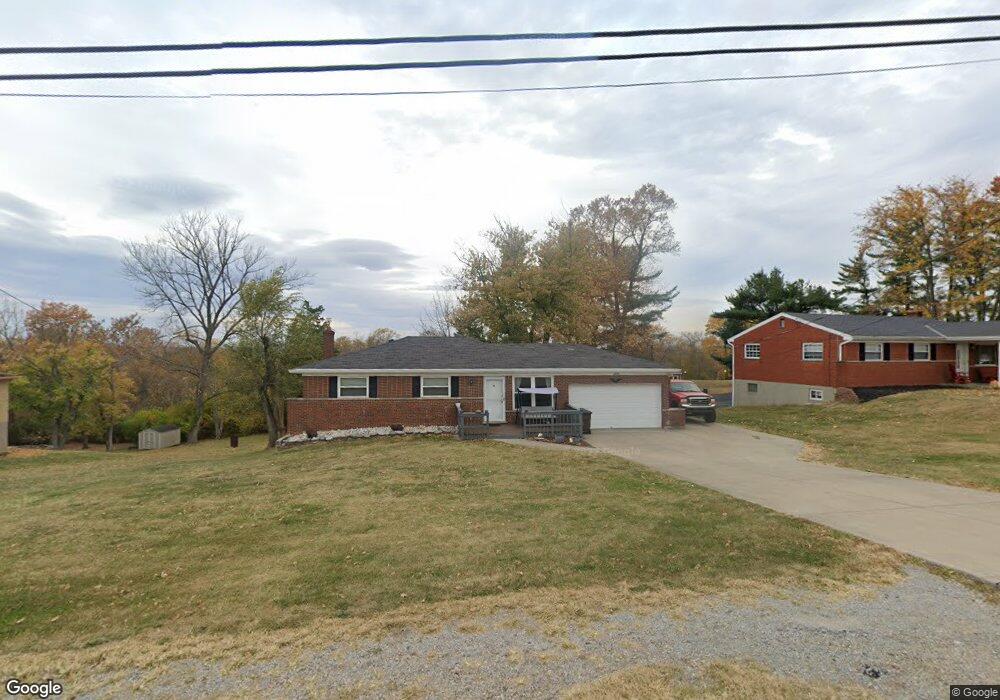
6490 Hayes Rd Cincinnati, OH 45248
Estimated Value: $222,128 - $254,000
3
Beds
1
Bath
1,064
Sq Ft
$224/Sq Ft
Est. Value
About This Home
This home is located at 6490 Hayes Rd, Cincinnati, OH 45248 and is currently estimated at $238,532, approximately $224 per square foot. 6490 Hayes Rd is a home located in Hamilton County with nearby schools including Charles W Springmyer Elementary School, Bridgetown Middle School, and Oak Hills High School.
Ownership History
Date
Name
Owned For
Owner Type
Purchase Details
Closed on
Jul 14, 2023
Sold by
Penwell Joseph P
Bought by
Penwell Deidra
Current Estimated Value
Home Financials for this Owner
Home Financials are based on the most recent Mortgage that was taken out on this home.
Original Mortgage
$169,866
Outstanding Balance
$165,066
Interest Rate
6.71%
Mortgage Type
FHA
Estimated Equity
$73,466
Purchase Details
Closed on
May 6, 2005
Sold by
Enginger Donald and Enginger Judith A
Bought by
Penwell Joseph P
Home Financials for this Owner
Home Financials are based on the most recent Mortgage that was taken out on this home.
Original Mortgage
$123,000
Interest Rate
6.05%
Mortgage Type
Unknown
Create a Home Valuation Report for This Property
The Home Valuation Report is an in-depth analysis detailing your home's value as well as a comparison with similar homes in the area
Home Values in the Area
Average Home Value in this Area
Purchase History
| Date | Buyer | Sale Price | Title Company |
|---|---|---|---|
| Penwell Deidra | $173,000 | Northwest Title | |
| Penwell Joseph P | $130,000 | Chicago Title Insurance Co |
Source: Public Records
Mortgage History
| Date | Status | Borrower | Loan Amount |
|---|---|---|---|
| Open | Penwell Deidra | $169,866 | |
| Previous Owner | Penwell Joseph P | $123,000 |
Source: Public Records
Tax History
| Year | Tax Paid | Tax Assessment Tax Assessment Total Assessment is a certain percentage of the fair market value that is determined by local assessors to be the total taxable value of land and additions on the property. | Land | Improvement |
|---|---|---|---|---|
| 2025 | $3,387 | $64,946 | $15,834 | $49,112 |
| 2024 | $3,304 | $64,946 | $15,834 | $49,112 |
| 2023 | $3,307 | $64,946 | $15,834 | $49,112 |
| 2022 | $2,611 | $43,421 | $15,414 | $28,007 |
| 2021 | $2,345 | $43,421 | $15,414 | $28,007 |
| 2020 | $2,375 | $43,421 | $15,414 | $28,007 |
| 2019 | $2,325 | $38,770 | $13,762 | $25,008 |
| 2018 | $2,328 | $38,770 | $13,762 | $25,008 |
| 2017 | $2,195 | $38,770 | $13,762 | $25,008 |
| 2016 | $2,054 | $36,215 | $13,073 | $23,142 |
| 2015 | $2,072 | $36,215 | $13,073 | $23,142 |
| 2014 | $2,074 | $36,215 | $13,073 | $23,142 |
| 2013 | $2,040 | $38,122 | $13,762 | $24,360 |
Source: Public Records
Map
Nearby Homes
- 3105 Laurel Hill Ln
- 3108 Laurel Hill Ln
- 4483 Ebenezer Rd
- 6560 Springmyer Dr
- 3905 Springoak Dr
- 3866 Springoak Dr
- 5703 Irwin Dr
- 5779 Irwin Dr
- 5771 Irwin Dr
- 5767 Irwin Dr
- 1 Hutchinson Rd
- 4181 Hutchinson Rd
- 6989 Carlinridge Ln
- 4510 Clearwater Place
- 6214 Berauer Rd
- 4512 Clearwater Place
- 5775 Irwin Dr
- 6880 Rackview Rd
- 6289 Eagles Lake Dr
- 3986 Trailside Dr
- 6480 Hayes Rd
- 6502 Hayes Rd
- 6478 Hayes Rd
- 6512 Hayes Rd
- 6476 Hayes Rd
- 6464 Hayes Rd
- 3113 Fiddlers Green Rd
- 1 Gatlinburg Trail Unit 1
- 2 Gatlinburg Trail
- 50 Deerview Dr Unit Lt 50
- 2 Pattys Place
- 7 Pattys Place
- 3 Pattys Place
- 10 Lot #10 Pattys Place
- 6530 Hayes Rd
- 6532 Hayes Rd
- 6460 Hayes Rd
- 6544 Hayes Rd
- 6535 Hayes Rd
- 6456 Hayes Rd
Your Personal Tour Guide
Ask me questions while you tour the home.