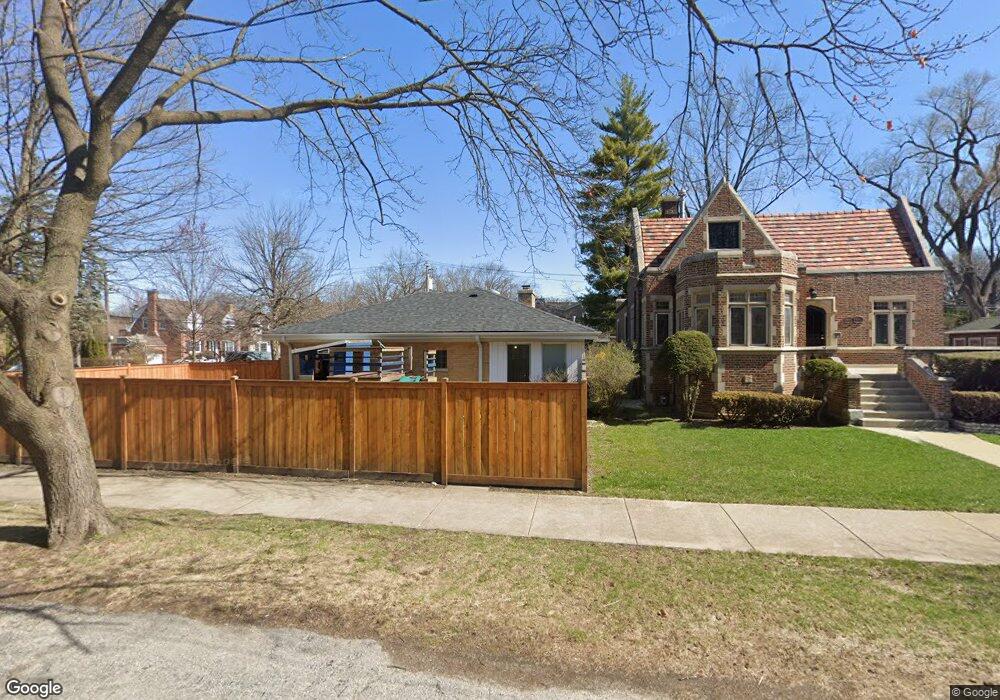
6493 N Caldwell Ave Chicago, IL 60646
Wildwood NeighborhoodEstimated Value: $561,000 - $638,479
3
Beds
2
Baths
1,749
Sq Ft
$354/Sq Ft
Est. Value
About This Home
This home is located at 6493 N Caldwell Ave, Chicago, IL 60646 and is currently estimated at $618,620, approximately $353 per square foot. 6493 N Caldwell Ave is a home located in Cook County with nearby schools including Wildwood IB World Magnet School, Taft High School, and St Mary Of The Woods School.
Ownership History
Date
Name
Owned For
Owner Type
Purchase Details
Closed on
Mar 26, 2025
Sold by
Supreme Lending and Everett Financial Inc
Bought by
Federal National Mortgage Association
Current Estimated Value
Purchase Details
Closed on
Jan 3, 2025
Sold by
Judicial Sales Corporation
Bought by
Supreme Lending and Everett Financial Inc
Purchase Details
Closed on
Jul 28, 2016
Sold by
Trevino Duffy Douglas M and Trevino Duffy Norma
Bought by
Lazaris Nick and Lazaris Helen
Home Financials for this Owner
Home Financials are based on the most recent Mortgage that was taken out on this home.
Original Mortgage
$408,500
Interest Rate
4.5%
Mortgage Type
New Conventional
Purchase Details
Closed on
Jun 15, 2010
Sold by
Gressick Linda
Bought by
Trevino Duffy Douglas M and Trevino Duffy Norma
Home Financials for this Owner
Home Financials are based on the most recent Mortgage that was taken out on this home.
Original Mortgage
$321,525
Interest Rate
4.97%
Mortgage Type
FHA
Create a Home Valuation Report for This Property
The Home Valuation Report is an in-depth analysis detailing your home's value as well as a comparison with similar homes in the area
Home Values in the Area
Average Home Value in this Area
Purchase History
| Date | Buyer | Sale Price | Title Company |
|---|---|---|---|
| Federal National Mortgage Association | -- | None Listed On Document | |
| Supreme Lending | -- | None Listed On Document | |
| Lazaris Nick | $430,000 | Attorney | |
| Trevino Duffy Douglas M | $331,000 | None Available |
Source: Public Records
Mortgage History
| Date | Status | Borrower | Loan Amount |
|---|---|---|---|
| Previous Owner | Lazaris Nick | $408,500 | |
| Previous Owner | Trevino Duffy Douglas M | $321,525 |
Source: Public Records
Tax History Compared to Growth
Tax History
| Year | Tax Paid | Tax Assessment Tax Assessment Total Assessment is a certain percentage of the fair market value that is determined by local assessors to be the total taxable value of land and additions on the property. | Land | Improvement |
|---|---|---|---|---|
| 2024 | $10,694 | $49,001 | $19,887 | $29,114 |
| 2023 | $10,403 | $54,001 | $16,038 | $37,963 |
| 2022 | $10,403 | $54,001 | $16,038 | $37,963 |
| 2021 | $10,189 | $53,999 | $16,037 | $37,962 |
| 2020 | $8,122 | $39,560 | $8,660 | $30,900 |
| 2019 | $7,950 | $43,000 | $8,660 | $34,340 |
| 2018 | $8,494 | $43,000 | $8,660 | $34,340 |
| 2017 | $8,116 | $37,703 | $7,698 | $30,005 |
| 2016 | $7,051 | $37,703 | $7,698 | $30,005 |
| 2015 | $6,428 | $37,703 | $7,698 | $30,005 |
| 2014 | $5,665 | $33,100 | $6,415 | $26,685 |
| 2013 | $5,542 | $33,100 | $6,415 | $26,685 |
Source: Public Records
Map
Nearby Homes
- 6505 N Ponchartrain Blvd
- 6575 N Caldwell Ave
- 6745 N Leoti Ave
- 6846 N Dowagiac Ave
- 5338 W Devon Ave
- 6782 N Jean Ave
- 6718 N Jean Ave
- 6612 N Ramona Ave
- 6923 N Chicora Ave
- 6870 N Wildwood Ave
- 6835 N Waukesha Ave
- 6955 N Dowagiac Ave
- 6011 N Monitor Ave
- 6709 N Ramona Ave
- 6741 N Ramona Ave
- 6908 N Mendota Ave
- 6117 N Meade Ave
- 5446 W Lunt Ave
- 6321 N Merrimac Ave
- 5971 N Elston Ave Unit 1
- 6491 N Caldwell Ave
- 6487 N Caldwell Ave
- 6515 N Ponchartrain Blvd
- 6506 N Ponchartrain Blvd
- 6481 N Caldwell Ave
- 6521 N Ponchartrain Blvd
- 6521 N Ponchartrain Blvd
- 6507 N Caldwell Ave
- 6516 N Waukesha Ave
- 6477 N Caldwell Ave
- 6514 N Ponchartrain Blvd
- 6525 N Ponchartrain Blvd
- 6520 N Waukesha Ave
- 6520 N Ponchartrain Blvd
- 6515 N Caldwell Ave
- 6524 N Waukesha Ave
- 6529 N Ponchartrain Blvd
- 6517 N Caldwell Ave
- 6530 N Waukesha Ave
- 6532 N Ponchartrain Blvd