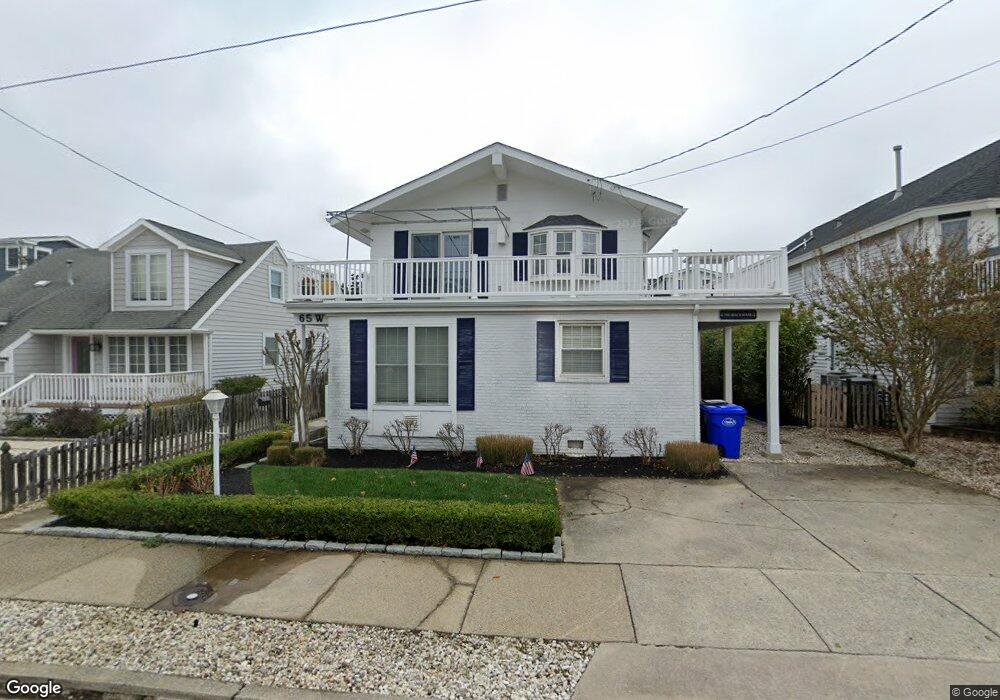
65 18th St W Avalon, NJ 08202
Estimated Value: $2,811,565 - $4,232,000
--
Bed
--
Bath
1,852
Sq Ft
$1,758/Sq Ft
Est. Value
About This Home
This home is located at 65 18th St W, Avalon, NJ 08202 and is currently estimated at $3,256,141, approximately $1,758 per square foot. 65 18th St W is a home located in Cape May County with nearby schools including Avalon Elementary School.
Ownership History
Date
Name
Owned For
Owner Type
Purchase Details
Closed on
Apr 22, 2008
Sold by
Thornton Elizabeth A
Bought by
Mcdonald James F and Mcdonald Catherine A
Current Estimated Value
Home Financials for this Owner
Home Financials are based on the most recent Mortgage that was taken out on this home.
Original Mortgage
$143,000
Outstanding Balance
$116,377
Interest Rate
5.93%
Mortgage Type
Credit Line Revolving
Estimated Equity
$3,139,764
Create a Home Valuation Report for This Property
The Home Valuation Report is an in-depth analysis detailing your home's value as well as a comparison with similar homes in the area
Home Values in the Area
Average Home Value in this Area
Purchase History
| Date | Buyer | Sale Price | Title Company |
|---|---|---|---|
| Mcdonald James F | $1,360,000 | None Available |
Source: Public Records
Mortgage History
| Date | Status | Borrower | Loan Amount |
|---|---|---|---|
| Open | Mcdonald James F | $143,000 | |
| Open | Mcdonald James F | $417,000 |
Source: Public Records
Tax History Compared to Growth
Tax History
| Year | Tax Paid | Tax Assessment Tax Assessment Total Assessment is a certain percentage of the fair market value that is determined by local assessors to be the total taxable value of land and additions on the property. | Land | Improvement |
|---|---|---|---|---|
| 2025 | $8,178 | $1,332,000 | $1,200,000 | $132,000 |
| 2024 | $8,178 | $1,332,000 | $1,200,000 | $132,000 |
| 2023 | $8,112 | $1,332,000 | $1,200,000 | $132,000 |
| 2022 | $7,566 | $1,332,000 | $1,200,000 | $132,000 |
| 2021 | $7,286 | $1,332,000 | $1,200,000 | $132,000 |
| 2020 | $7,006 | $1,332,000 | $1,200,000 | $132,000 |
| 2019 | $6,793 | $1,332,000 | $1,200,000 | $132,000 |
| 2018 | $6,500 | $1,332,000 | $1,200,000 | $132,000 |
| 2017 | $5,735 | $1,031,500 | $900,000 | $131,500 |
| 2016 | $5,673 | $1,031,500 | $900,000 | $131,500 |
| 2015 | $5,580 | $1,031,500 | $900,000 | $131,500 |
| 2014 | $5,519 | $1,031,500 | $900,000 | $131,500 |
Source: Public Records
Map
Nearby Homes