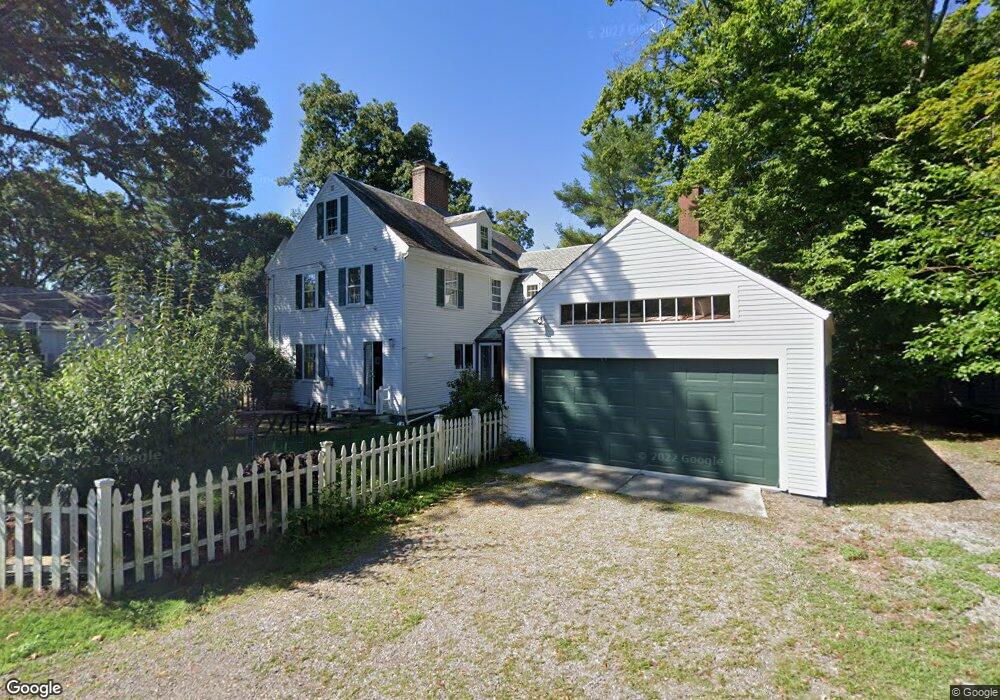
65 Agawam Rd Waban, MA 02468
Waban NeighborhoodEstimated Value: $1,676,000 - $2,111,000
7
Beds
4
Baths
2,715
Sq Ft
$717/Sq Ft
Est. Value
About This Home
This home is located at 65 Agawam Rd, Waban, MA 02468 and is currently estimated at $1,945,575, approximately $716 per square foot. 65 Agawam Rd is a home located in Middlesex County with nearby schools including Angier Elementary School, Charles E Brown Middle School, and Newton South High School.
Ownership History
Date
Name
Owned For
Owner Type
Purchase Details
Closed on
Sep 11, 2018
Sold by
Macmillan-Doelling Jean
Bought by
J Macmillan Doelling R
Current Estimated Value
Purchase Details
Closed on
Feb 9, 2016
Sold by
Doelling Norman and Doelling Jean M
Bought by
Macmillan-Doelling Jean
Purchase Details
Closed on
Sep 6, 2013
Sold by
Norman Doelling Ret and Doelling Norman
Bought by
Doelling Norman and Doelling Jean M
Purchase Details
Closed on
Jun 13, 2008
Sold by
Macmillan-Doelling Jean and Doelling Norman
Bought by
J Macmillan Doelling R and Doelling J Macmillan
Create a Home Valuation Report for This Property
The Home Valuation Report is an in-depth analysis detailing your home's value as well as a comparison with similar homes in the area
Home Values in the Area
Average Home Value in this Area
Purchase History
| Date | Buyer | Sale Price | Title Company |
|---|---|---|---|
| J Macmillan Doelling R | -- | -- | |
| Macmillan-Doelling Jean | -- | -- | |
| Doelling Norman | -- | -- | |
| J Macmillan Doelling R | -- | -- |
Source: Public Records
Tax History
| Year | Tax Paid | Tax Assessment Tax Assessment Total Assessment is a certain percentage of the fair market value that is determined by local assessors to be the total taxable value of land and additions on the property. | Land | Improvement |
|---|---|---|---|---|
| 2025 | $15,770 | $1,609,200 | $1,408,000 | $201,200 |
| 2024 | $15,248 | $1,562,300 | $1,367,000 | $195,300 |
| 2023 | $14,471 | $1,421,500 | $1,065,100 | $356,400 |
| 2022 | $13,846 | $1,316,200 | $986,200 | $330,000 |
| 2021 | $13,361 | $1,241,700 | $930,400 | $311,300 |
| 2020 | $12,963 | $1,241,700 | $930,400 | $311,300 |
| 2019 | $12,597 | $1,205,500 | $903,300 | $302,200 |
| 2018 | $12,142 | $1,122,200 | $816,000 | $306,200 |
| 2017 | $11,773 | $1,058,700 | $769,800 | $288,900 |
| 2016 | $11,259 | $989,400 | $719,400 | $270,000 |
| 2015 | $10,736 | $924,700 | $672,300 | $252,400 |
Source: Public Records
Map
Nearby Homes
- 447 Waban Ave
- 64 Varick Rd
- 31 Wilde Rd
- 26 Varick Hill Rd
- 177 Varick Rd
- 0 Metacomet Rd
- 33 Metacomet Rd
- 577 Grove St
- 8 Damien Rd
- 91 Waban Ave
- 20 Kinmonth Rd Unit 203
- 20 Kinmonth Rd Unit 306
- 20 Kinmonth Rd Unit 4
- 18 Annawan Rd
- 12 Oakwood Rd
- 5 Tennyson Rd
- 115 Windsor Rd
- 32 Lantern Ln
- 6 Intervale Rd
- 17 Lasell St
Your Personal Tour Guide
Ask me questions while you tour the home.