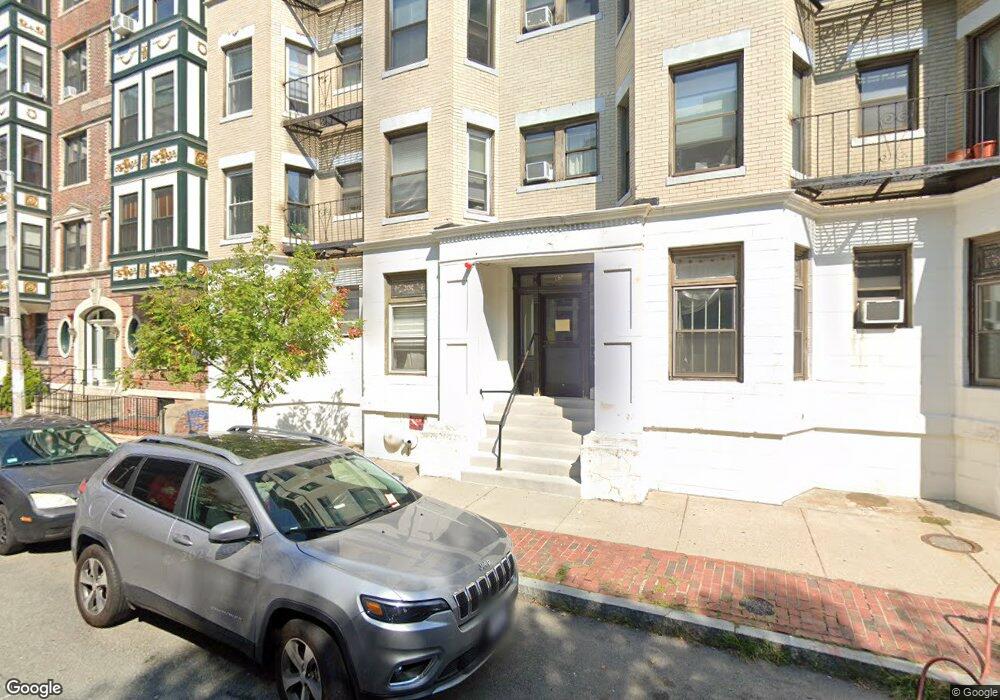
65 Burbank St Unit 22 Boston, MA 02115
Fenway NeighborhoodEstimated Value: $456,000 - $508,000
1
Bed
1
Bath
9,999
Sq Ft
$48/Sq Ft
Est. Value
About This Home
This home is located at 65 Burbank St Unit 22, Boston, MA 02115 and is currently estimated at $479,810, approximately $47 per square foot. 65 Burbank St Unit 22 is a home located in Suffolk County with nearby schools including Edward M. Kennedy Academy for Health Careers, Kingsley Montessori School, and The Newman School.
Ownership History
Date
Name
Owned For
Owner Type
Purchase Details
Closed on
Nov 28, 2005
Sold by
Hajer Rob
Bought by
Jacobs Charles
Current Estimated Value
Purchase Details
Closed on
Oct 16, 1997
Sold by
Elkins Webb
Bought by
Window Rt and Hofeller Edward D
Purchase Details
Closed on
Sep 6, 1991
Sold by
Odonnell Charles E
Bought by
Rtc
Create a Home Valuation Report for This Property
The Home Valuation Report is an in-depth analysis detailing your home's value as well as a comparison with similar homes in the area
Home Values in the Area
Average Home Value in this Area
Purchase History
| Date | Buyer | Sale Price | Title Company |
|---|---|---|---|
| Jacobs Charles | $137,500 | -- | |
| Chen Mary | $275,000 | -- | |
| Jacobs Charles | $137,500 | -- | |
| Window Rt | $50,000 | -- | |
| Rtc | $38,500 | -- |
Source: Public Records
Tax History Compared to Growth
Tax History
| Year | Tax Paid | Tax Assessment Tax Assessment Total Assessment is a certain percentage of the fair market value that is determined by local assessors to be the total taxable value of land and additions on the property. | Land | Improvement |
|---|---|---|---|---|
| 2025 | $4,828 | $416,900 | $0 | $416,900 |
| 2024 | $4,510 | $413,800 | $0 | $413,800 |
| 2023 | $4,312 | $401,500 | $0 | $401,500 |
| 2022 | $4,285 | $393,800 | $0 | $393,800 |
| 2021 | $4,119 | $386,000 | $0 | $386,000 |
| 2020 | $3,787 | $358,600 | $0 | $358,600 |
| 2019 | $3,532 | $335,100 | $0 | $335,100 |
| 2018 | $3,252 | $310,300 | $0 | $310,300 |
| 2017 | $3,128 | $295,400 | $0 | $295,400 |
| 2016 | $3,094 | $281,300 | $0 | $281,300 |
| 2015 | $2,928 | $241,800 | $0 | $241,800 |
| 2014 | $2,763 | $219,600 | $0 | $219,600 |
Source: Public Records
Map
Nearby Homes
- 75 Burbank St Unit 501
- 75 Burbank St Unit 203
- 43 Westland Ave Unit 610
- 12 Stoneholm St Unit 420
- 12 Stoneholm St Unit 614
- 12 Stoneholm St Unit 423
- 12 Stoneholm St Unit 307
- 12 Stoneholm St Unit 529
- 30 Fenway Unit 2nd/3rd FL
- 28 Fenway
- 183-185 Massachusetts Ave Unit 602
- 179 Massachusetts Ave
- 17 Symphony Rd Unit 8
- 17 Symphony Rd Unit 6
- 70 Fenway Unit 51
- 74 Fenway Unit 56
- 74 Fenway Unit 35
- 102 & 108 Gainsborough St Unit 406W
- 52 Charlesgate E Unit 160
- 360 Newbury St Unit 601
- 65 Burbank St Unit 28
- 65 Burbank St Unit 27
- 65 Burbank St Unit 26
- 65 Burbank St Unit 25
- 65 Burbank St Unit 24
- 65 Burbank St Unit 23
- 65 Burbank St Unit 21
- 65 Burbank St Unit 20
- 65 Burbank St Unit 19
- 65 Burbank St Unit 18
- 65 Burbank St Unit 17
- 65 Burbank St Unit 16
- 65 Burbank St Unit 15
- 65 Burbank St Unit 14
- 65 Burbank St Unit 12A
- 65 Burbank St Unit 12
- 65 Burbank St Unit 11
- 65 Burbank St Unit 10
- 65 Burbank St Unit 9
- 65 Burbank St Unit 8