NOT LISTED FOR SALE

65 Cloister Place Unit 168 Staten Island, NY 10306

New Dorp Neighborhood

Estimated Value: $883,451 - $1,122,000

2 Beds
3 Baths
2,588 Sq Ft
$376/Sq Ft Est. Value

Last Sold October 17, 2019

Last sale price $685,000 $265 Per Sq Ft

Est. 42% increase in value since last sale

Current estimated payment $5,887/month

About This Home

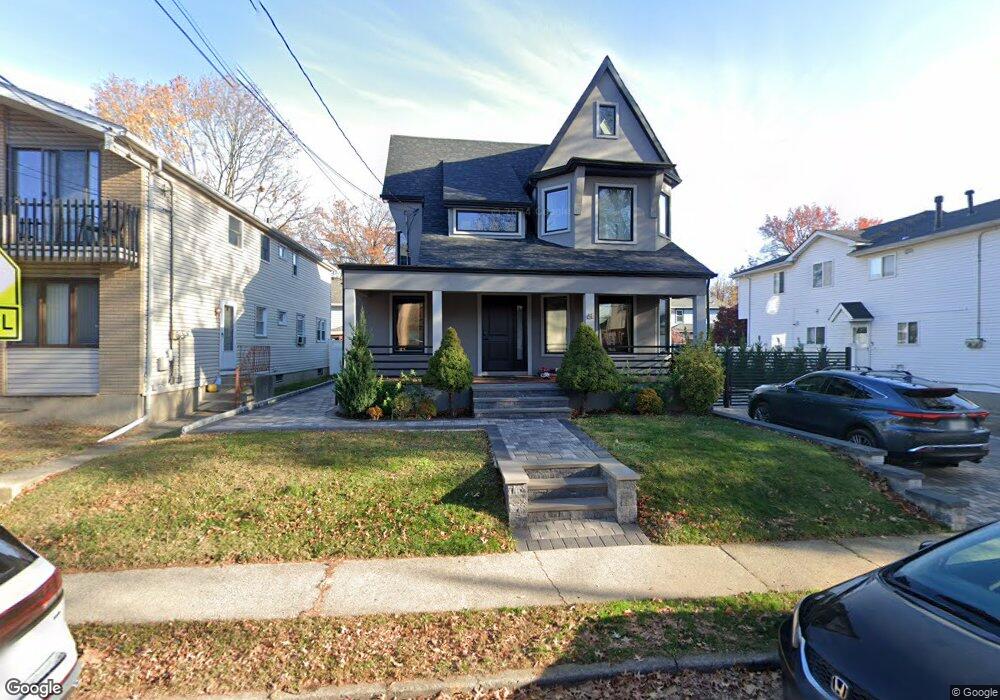
Large Older Victorian On 6,000 SqFt Lot In Heart Of Fabulous New Dorp. Close To Everything, No Need To Hop In Your Car! Interesting Home With Many Rooms & Versatile Potential. Legal Two Family (Converted In 1982) Can Be Used As A One Or Two Family -- The Choice Is Yours! Must See To Appreciate.

Ownership History

Date Name Owned For Owner Type

Purchase Details

Listed on
Jul 16, 2019
Closed on
Oct 17, 2019
Sold by
Brien James O and Neral Maryann
Bought by
Szpak Emilia
Seller's Agent
Sari Kingsley
Sari Kingsley, Real Estate
Buyer's Agent
Chanpen Cronin
RE/MAX Elite
List Price
$705,000
Sold Price
$685,000
Premium/Discount to List
-$20,000
-2.84%
Current Estimated Value
$973,613

Home Financials for this Owner

Home Financials are based on the most recent Mortgage that was taken out on this home.
Estimated Appreciation
$288,613
Avg. Annual Appreciation
5.88%

Purchase Details

Closed on
Aug 15, 1996
Sold by
Foster Brian M and Burns Nancy P
Bought by
Digirolamo Marie
Source: Public Records

Range of Values:

--
Value Increase
--
Percent Increase
--
Adjusted for Inflation
Collateral Analytics

Collateral Analytics Collateral Analytics AVMs (Automated Valuation Model) employ a number of statistical approaches combined with neighborhood-specific comparable selection guarantees the most up-to-date and precise valuations.

Not Available

Collateral Analytics does not have data for the current month. Please view the chart for historical values.

ICE

ICE Mortgage Technology ICE Mortgage Technology’s AVM (Automated Valuation Model) is a state-of-the-art online residential property valuation tool that provides a quick and accurate estimate of the value of almost any home in the U.S.

Not Available

ICE Mortgage Technology does not have data for the current month. Please view the chart for historical values.

First American

First American First American Data & Analytics’ next-generation AVM combines unrivaled data assets with a blended ensemble of valuation models to produce highly accurate, reliable valuations you can trust.

Not Available

First American does not have data for the current month. Please view the chart for historical values.

Quantarium

Quantarium Quantarium’s valuation service, repeatedly proven the industry’s most accurate and comprehensive, is supercharged with a self-learning and auto-tuning AI engine that continually becomes smarter and more accurate as it processes daily inputs from the industry’s leading RE data lake.

Not Available

Quantarium does not have data for the current month. Please view the chart for historical values.

Average Value
Not Available
List Price
Sold Price
Create a Home Valuation Report for This Property
The Home Valuation Report is an in-depth analysis detailing your home's value as well as a comparison with similar homes in the area

Home Values in the Area

Source: Public Records

Average Home Value in this Area


Source: Public Records

Purchase History

Date Buyer Sale Price Title Company
Szpak Emilia $685,000 None Available
Digirolamo Marie $118,000 --
Source: Public Records

Property History

Date Event Price List to Sale Price per Sq Ft Prior Sale
10/17/2019 10/17/19 Sold $685,000 -2.8% $265 / Sq Ft View Prior Sale
08/01/2019 08/01/19 Pending -- -- --
07/16/2019 07/16/19 For Sale $705,000 -- $272 / Sq Ft

Tax History Compared to Growth

Source: Public Records

Tax History

Year Tax Paid Tax Assessment Tax Assessment Total Assessment is a certain percentage of the fair market value that is determined by local assessors to be the total taxable value of land and additions on the property. Land Improvement
2025 $9,179 $51,300 $11,520 $39,780
2024 $9,179 $51,660 $11,359 $40,301
2023 $8,694 $43,286 $9,046 $34,240
2022 $7,343 $51,660 $12,840 $38,820
2021 $7,546 $48,360 $12,840 $35,520
2020 $8,047 $46,560 $12,840 $33,720
2019 $3,104 $46,020 $12,840 $33,180
2018 $2,782 $33,572 $11,440 $22,132
2017 $5,458 $31,672 $11,507 $20,165
2016 $2,190 $29,880 $11,668 $18,212
2015 $2,072 $29,880 $10,680 $19,200
2014 $2,072 $29,655 $10,599 $19,056
Source: Public Records

Agents Affiliated with this Home

  • Section Image
  • Section Image
See All Agents

Map