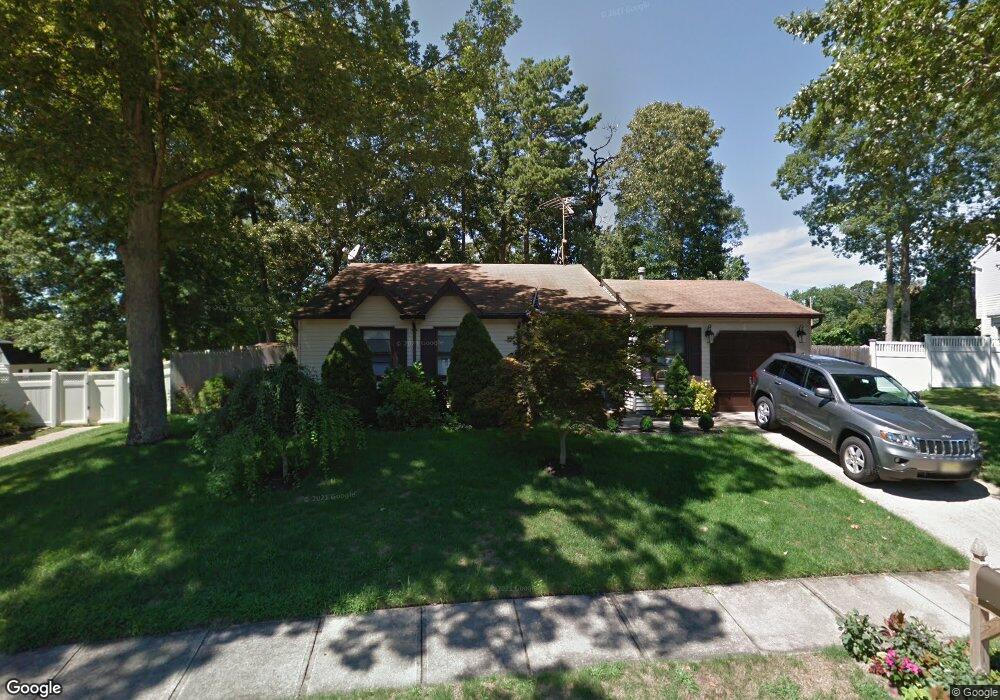
65 Concord Cir Howell, NJ 07731
Southard NeighborhoodEstimated Value: $594,000 - $640,000
4
Beds
2
Baths
1,410
Sq Ft
$434/Sq Ft
Est. Value
About This Home
This home is located at 65 Concord Cir, Howell, NJ 07731 and is currently estimated at $611,681, approximately $433 per square foot. 65 Concord Cir is a home located in Monmouth County with nearby schools including Taunton School, Aldrich School, and Howell Township Middle School South.
Ownership History
Date
Name
Owned For
Owner Type
Purchase Details
Closed on
Jan 3, 2003
Sold by
Gunzenhauser Richard
Bought by
Pietri Andrew and Pietri Amy
Current Estimated Value
Home Financials for this Owner
Home Financials are based on the most recent Mortgage that was taken out on this home.
Original Mortgage
$221,900
Interest Rate
5.94%
Purchase Details
Closed on
Aug 28, 2001
Sold by
Picarello Joseph
Bought by
Gunzenhauser Richard and Gunzenhauser Susan
Create a Home Valuation Report for This Property
The Home Valuation Report is an in-depth analysis detailing your home's value as well as a comparison with similar homes in the area
Home Values in the Area
Average Home Value in this Area
Purchase History
| Date | Buyer | Sale Price | Title Company |
|---|---|---|---|
| Pietri Andrew | $234,900 | -- | |
| Gunzenhauser Richard | $173,000 | -- | |
| Gunzenhauser Richard | $173,000 | -- |
Source: Public Records
Mortgage History
| Date | Status | Borrower | Loan Amount |
|---|---|---|---|
| Previous Owner | Pietri Andrew | $221,900 |
Source: Public Records
Tax History
| Year | Tax Paid | Tax Assessment Tax Assessment Total Assessment is a certain percentage of the fair market value that is determined by local assessors to be the total taxable value of land and additions on the property. | Land | Improvement |
|---|---|---|---|---|
| 2025 | $8,687 | $551,600 | $388,800 | $162,800 |
| 2024 | $8,092 | $488,600 | $328,800 | $159,800 |
| 2023 | $8,092 | $434,800 | $278,800 | $156,000 |
| 2022 | $6,941 | $355,100 | $193,800 | $161,300 |
| 2021 | $6,941 | $302,300 | $158,800 | $143,500 |
| 2020 | $6,866 | $295,700 | $153,800 | $141,900 |
| 2019 | $6,937 | $293,200 | $153,800 | $139,400 |
| 2018 | $6,945 | $291,700 | $158,800 | $132,900 |
| 2017 | $6,398 | $265,700 | $136,800 | $128,900 |
| 2016 | $6,189 | $254,500 | $128,800 | $125,700 |
| 2015 | $6,371 | $259,300 | $136,900 | $122,400 |
| 2014 | $6,085 | $229,800 | $132,500 | $97,300 |
Source: Public Records
Map
Nearby Homes
- 43 Lake Dr
- 17 Providence Ln
- 19 Silversmith Ct
- 28 Standish Dr
- 18 Plymouth Dr
- 15 Standish Dr
- 9 Cove Ct
- 3 Lake Dr
- 15 Hearth Ct
- 1004 Woodlane Rd
- 231 Friendship Rd
- 73 E Connecticut Concourse
- 10 Cooper Dr
- 13 Heritage Dr
- 7 Colonial Ct
- 90 E Connecticut Concourse
- 4 Cherry Tree Cir
- 1243 Aldrich Rd
- 30 Heritage Dr
- 284 Friendship Rd
Your Personal Tour Guide
Ask me questions while you tour the home.