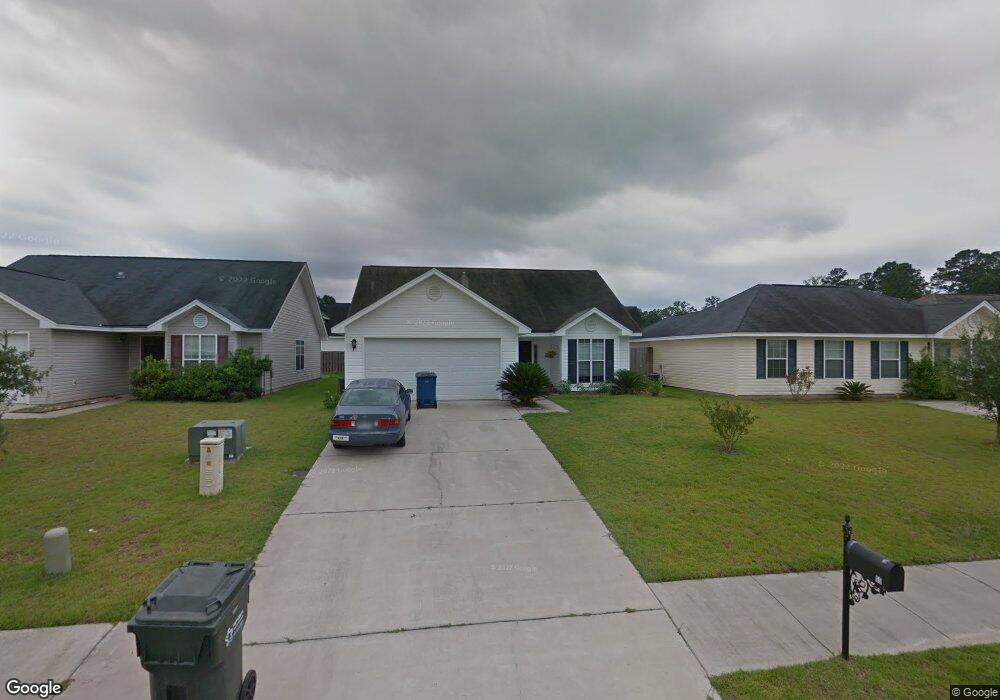
65 Cordage Cir Savannah, GA 31407
Estimated Value: $257,000 - $261,075
3
Beds
2
Baths
1,283
Sq Ft
$202/Sq Ft
Est. Value
About This Home
This home is located at 65 Cordage Cir, Savannah, GA 31407 and is currently estimated at $258,769, approximately $201 per square foot. 65 Cordage Cir is a home located in Chatham County with nearby schools including Rice Creek K-8 School and Groves High School.
Ownership History
Date
Name
Owned For
Owner Type
Purchase Details
Closed on
May 12, 2008
Sold by
Not Provided
Bought by
Kessler Robert L
Current Estimated Value
Purchase Details
Closed on
Dec 15, 2006
Sold by
Not Provided
Bought by
Ortiz Joseph M and Ortiz Becky J
Home Financials for this Owner
Home Financials are based on the most recent Mortgage that was taken out on this home.
Original Mortgage
$141,440
Interest Rate
6.19%
Mortgage Type
FHA
Purchase Details
Closed on
Dec 30, 2004
Sold by
Rande Duke Construction Inc
Bought by
Villanueva Dennis and Marquez Mayra D
Home Financials for this Owner
Home Financials are based on the most recent Mortgage that was taken out on this home.
Original Mortgage
$112,058
Interest Rate
5.71%
Mortgage Type
VA
Purchase Details
Closed on
Sep 10, 2004
Sold by
Southtrust Bank
Bought by
New City Development Llc
Create a Home Valuation Report for This Property
The Home Valuation Report is an in-depth analysis detailing your home's value as well as a comparison with similar homes in the area
Home Values in the Area
Average Home Value in this Area
Purchase History
| Date | Buyer | Sale Price | Title Company |
|---|---|---|---|
| Kessler Robert L | $129,000 | -- | |
| Ortiz Joseph M | $143,700 | -- | |
| Villanueva Dennis | $109,700 | -- | |
| Villanueva Dennis | -- | -- | |
| New City Development Llc | -- | -- | |
| Rande Duke Construction Inc | -- | -- |
Source: Public Records
Mortgage History
| Date | Status | Borrower | Loan Amount |
|---|---|---|---|
| Previous Owner | Ortiz Joseph M | $141,440 | |
| Previous Owner | Villanueva Dennis | $112,058 |
Source: Public Records
Tax History Compared to Growth
Tax History
| Year | Tax Paid | Tax Assessment Tax Assessment Total Assessment is a certain percentage of the fair market value that is determined by local assessors to be the total taxable value of land and additions on the property. | Land | Improvement |
|---|---|---|---|---|
| 2025 | $1,644 | $96,120 | $20,000 | $76,120 |
| 2024 | $1,644 | $86,040 | $18,000 | $68,040 |
| 2023 | $916 | $79,640 | $18,000 | $61,640 |
| 2022 | $1,436 | $63,640 | $8,000 | $55,640 |
| 2021 | $1,424 | $55,960 | $8,000 | $47,960 |
| 2020 | $1,438 | $54,560 | $8,000 | $46,560 |
| 2019 | $1,438 | $47,640 | $8,000 | $39,640 |
| 2018 | $1,613 | $46,080 | $8,000 | $38,080 |
| 2017 | $1,521 | $46,440 | $8,000 | $38,440 |
| 2016 | $1,307 | $39,920 | $8,000 | $31,920 |
| 2014 | -- | $40,200 | $0 | $0 |
Source: Public Records
Map
Nearby Homes
- 26 Halyard Dr
- 15 Newport Blvd
- 19 Halyard Dr
- 21 Hawser Way
- 10 Binnacle Ln
- 56 Bearing Cir
- 58 Bearing Cir Unit B
- 7 Corsair Cir
- 11 Cordage Cir
- 24 Transom Rd
- 32 Transom Rd
- 33 Gimbal Cir
- 150 Berrien Rd
- Lot 6 Raley Rd
- Lot 5 Raley Rd
- 16 Lanvale St
- 629 & 631 Meinhard Rd
- 1 Braxton Manor Dr
- 217 Monteith Rd
- 135 Monteith Rd