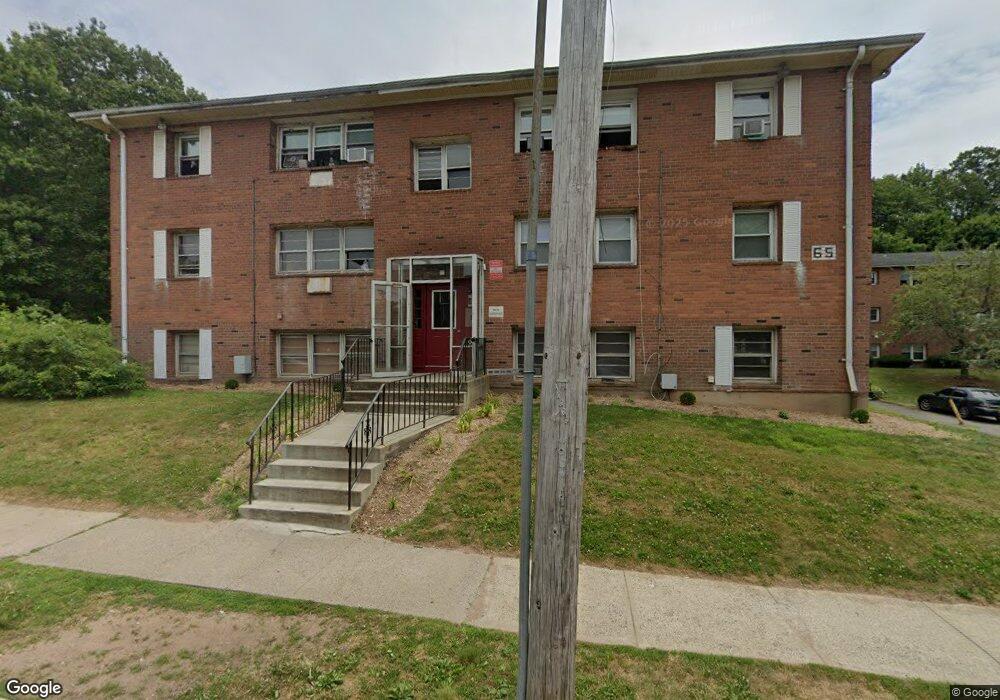
65 Donna Dr Unit A4 New Haven, CT 06513
Quinnipiac Meadows NeighborhoodEstimated Value: $78,067 - $95,000
2
Beds
1
Bath
796
Sq Ft
$107/Sq Ft
Est. Value
About This Home
This home is located at 65 Donna Dr Unit A4, New Haven, CT 06513 and is currently estimated at $85,356, approximately $107 per square foot. 65 Donna Dr Unit A4 is a home located in New Haven County with nearby schools including Bishop Woods Architecture and Design Magnet School, Elm City College Preparatory School, and All Saints Catholic Academy.
Ownership History
Date
Name
Owned For
Owner Type
Purchase Details
Closed on
Apr 11, 2017
Sold by
Raza Atif
Bought by
Abdurahman Fnu
Current Estimated Value
Purchase Details
Closed on
Dec 24, 2015
Sold by
Shan Wasif
Bought by
Raza Atif
Purchase Details
Closed on
Feb 14, 2014
Sold by
Khan Agha
Bought by
Shan Wasif
Purchase Details
Closed on
Jun 29, 1998
Sold by
Fnma
Bought by
Khan Agha
Home Financials for this Owner
Home Financials are based on the most recent Mortgage that was taken out on this home.
Original Mortgage
$80,600
Interest Rate
7.09%
Mortgage Type
Purchase Money Mortgage
Purchase Details
Closed on
Jun 29, 1988
Sold by
Lucibello Claire
Bought by
Khalsa Gurukaur
Home Financials for this Owner
Home Financials are based on the most recent Mortgage that was taken out on this home.
Original Mortgage
$26,800
Interest Rate
10.47%
Create a Home Valuation Report for This Property
The Home Valuation Report is an in-depth analysis detailing your home's value as well as a comparison with similar homes in the area
Home Values in the Area
Average Home Value in this Area
Purchase History
| Date | Buyer | Sale Price | Title Company |
|---|---|---|---|
| Abdurahman Fnu | -- | -- | |
| Raza Atif | -- | -- | |
| Shan Wasif | -- | -- | |
| Khan Agha | $11,200 | -- | |
| Khalsa Gurukaur | $33,500 | -- |
Source: Public Records
Mortgage History
| Date | Status | Borrower | Loan Amount |
|---|---|---|---|
| Previous Owner | Khalsa Gurukaur | $20,000 | |
| Previous Owner | Khalsa Gurukaur | $80,600 | |
| Previous Owner | Khalsa Gurukaur | $26,800 |
Source: Public Records
Tax History
| Year | Tax Paid | Tax Assessment Tax Assessment Total Assessment is a certain percentage of the fair market value that is determined by local assessors to be the total taxable value of land and additions on the property. | Land | Improvement |
|---|---|---|---|---|
| 2025 | $1,214 | $30,800 | $0 | $30,800 |
| 2024 | $1,186 | $30,800 | $0 | $30,800 |
| 2023 | $1,146 | $30,800 | $0 | $30,800 |
| 2022 | $1,224 | $30,800 | $0 | $30,800 |
| 2021 | $1,004 | $22,890 | $0 | $22,890 |
| 2020 | $1,004 | $22,890 | $0 | $22,890 |
| 2019 | $984 | $22,890 | $0 | $22,890 |
| 2018 | $984 | $22,890 | $0 | $22,890 |
| 2017 | $885 | $22,890 | $0 | $22,890 |
| 2016 | $809 | $19,460 | $0 | $19,460 |
| 2015 | $809 | $19,460 | $0 | $19,460 |
| 2014 | -- | $19,460 | $0 | $19,460 |
Source: Public Records
Map
Nearby Homes
- 1 Ellis St Unit 1
- 1423 Quinnipiac Ave Unit 808
- 1423 Quinnipiac Ave Unit 709
- 1423 Quinnipiac Ave Unit 602
- 1423 Quinnipiac Ave Unit 302
- 1445 Quinnipiac Ave
- 244 Weybosset St
- 1651 Quinnipiac Ave Unit 1651
- 1730 Quinnipiac Ave
- 116 Old Foxon Rd
- 300 Foxon Hill Rd
- 926 Quinnipiac Ave Unit 8
- 54 Lombard St
- 147 Lombard St
- 18 Kristen Ct
- 181 Lombard St
- 25 Pine St
- 31 Marie St Unit B
- 1380 State St
- 728 Quinnipiac Ave
- 65 Donna Dr Unit C6
- 65 Donna Dr Unit C5
- 65 Donna Dr Unit C4
- 65 Donna Dr Unit C3
- 65 Donna Dr Unit C2
- 65 Donna Dr Unit C1
- 65 Donna Dr Unit B6
- 65 Donna Dr Unit B5
- 65 Donna Dr Unit B4
- 65 Donna Dr Unit B3
- 65 Donna Dr Unit B2
- 65 Donna Dr Unit B1
- 65 Donna Dr Unit A5
- 65 Donna Dr Unit A3
- 65 Donna Dr Unit A2
- 45 Donna Dr Unit C8
- 45 Donna Dr Unit C7
- 45 Donna Dr Unit C6
- 45 Donna Dr Unit C5
- 45 Donna Dr Unit C4
Your Personal Tour Guide
Ask me questions while you tour the home.