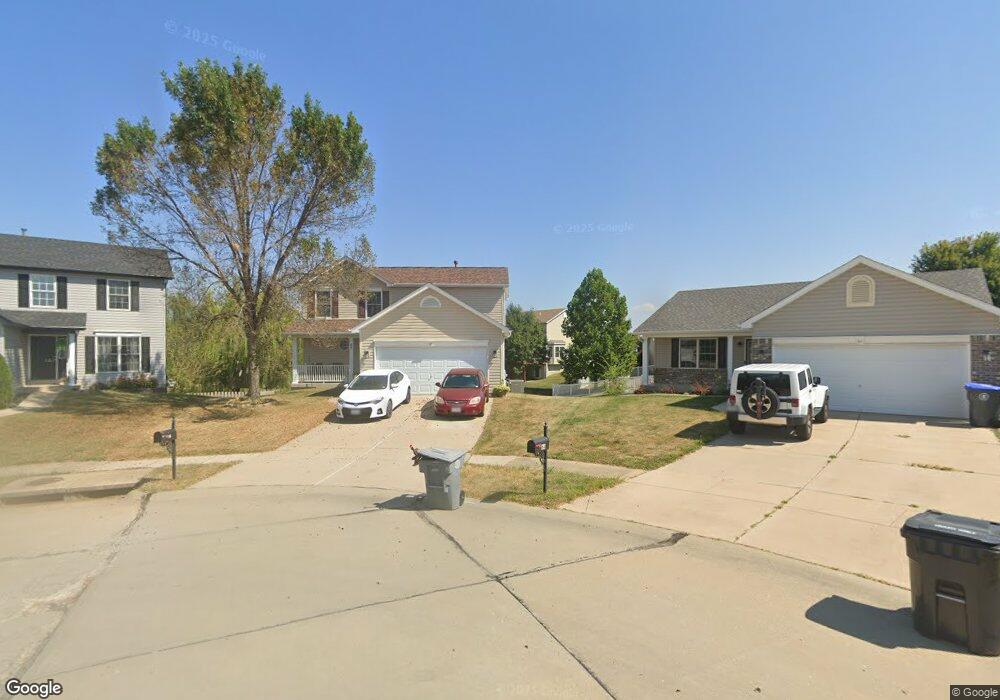
65 E Homefield Point Ct O Fallon, MO 63366
Estimated Value: $343,000 - $370,000
3
Beds
3
Baths
1,574
Sq Ft
$226/Sq Ft
Est. Value
About This Home
This home is located at 65 E Homefield Point Ct, O Fallon, MO 63366 and is currently estimated at $356,354, approximately $226 per square foot. 65 E Homefield Point Ct is a home located in St. Charles County with nearby schools including Westhoff Elementary School, Fort Zumwalt North Middle School, and Fort Zumwalt North High School.
Ownership History
Date
Name
Owned For
Owner Type
Purchase Details
Closed on
May 30, 2013
Sold by
Wolfe John Robert and Wolfe Dunn Vicki Jean
Bought by
Quinn Steven T and Quinn Elizabeth G
Current Estimated Value
Home Financials for this Owner
Home Financials are based on the most recent Mortgage that was taken out on this home.
Original Mortgage
$148,500
Outstanding Balance
$105,257
Interest Rate
3.41%
Mortgage Type
New Conventional
Estimated Equity
$251,097
Purchase Details
Closed on
Jul 7, 2009
Sold by
Wolfe John Robert
Bought by
Wolfe John Robert and Dunn Vicki Jean
Home Financials for this Owner
Home Financials are based on the most recent Mortgage that was taken out on this home.
Original Mortgage
$149,500
Interest Rate
5.39%
Mortgage Type
New Conventional
Purchase Details
Closed on
Jan 31, 2006
Sold by
T R Hughes Inc
Bought by
Wolfe John Robert
Home Financials for this Owner
Home Financials are based on the most recent Mortgage that was taken out on this home.
Original Mortgage
$19,438
Interest Rate
6.15%
Mortgage Type
Credit Line Revolving
Create a Home Valuation Report for This Property
The Home Valuation Report is an in-depth analysis detailing your home's value as well as a comparison with similar homes in the area
Home Values in the Area
Average Home Value in this Area
Purchase History
| Date | Buyer | Sale Price | Title Company |
|---|---|---|---|
| Quinn Steven T | $165,000 | Ust | |
| Wolfe John Robert | -- | Inv | |
| Wolfe John Robert | -- | Multiple | |
| Tr Hughes Inc | -- | Multiple |
Source: Public Records
Mortgage History
| Date | Status | Borrower | Loan Amount |
|---|---|---|---|
| Open | Quinn Steven T | $148,500 | |
| Previous Owner | Wolfe John Robert | $149,500 | |
| Previous Owner | Tr Hughes Inc | $19,438 | |
| Previous Owner | Wolfe John Robert | $155,508 |
Source: Public Records
Tax History Compared to Growth
Tax History
| Year | Tax Paid | Tax Assessment Tax Assessment Total Assessment is a certain percentage of the fair market value that is determined by local assessors to be the total taxable value of land and additions on the property. | Land | Improvement |
|---|---|---|---|---|
| 2025 | $3,320 | $56,078 | -- | -- |
| 2023 | $3,322 | $50,097 | $0 | $0 |
| 2022 | $2,987 | $41,880 | $0 | $0 |
| 2021 | $2,989 | $41,880 | $0 | $0 |
| 2020 | $2,755 | $37,392 | $0 | $0 |
| 2019 | $2,761 | $37,392 | $0 | $0 |
| 2018 | $2,690 | $34,784 | $0 | $0 |
| 2017 | $2,653 | $34,784 | $0 | $0 |
| 2016 | $2,416 | $31,547 | $0 | $0 |
| 2015 | $2,246 | $31,547 | $0 | $0 |
| 2014 | $2,010 | $27,753 | $0 | $0 |
Source: Public Records
Map
Nearby Homes
- 1612 Homefield Meadows Dr
- 1602 Homefield Meadows Dr
- 18 W Homefield Point Ct
- 2837 Grand Slam Dr
- 17 Homefield Gardens Dr
- 1818 Sapling Dr
- 0 Tom Ginnever Ave
- 6 Green Park Ln
- 57 Green Park Ln
- 1602 Platinum Ct
- 239 Crystal Ridge Dr
- 1110 Cypress Dr
- 621 Zumwalt Crossing
- 211 England Dr
- 6 S Boxwood Ln
- 127 Maryland Dr Unit 89A
- 6 Saint Paul Ct
- 439 Villa Blanc Ct Unit 17A
- 1 Warshire Ct
- 203 Saint Margaret Ln
- 63 E Homefield Point Ct
- 129 Homefield Lake Ct
- 127 Homefield Lake Ct
- 61 E Homefield Point Ct
- 62 E Homefield Point Ct
- 125 Homefield Lake Ct
- 131 Homefield Lake Ct
- 59 E Homefield Point Ct
- 60 E Homefield Point Ct
- 57 E Homefield Point Ct
- 1619 Homefield Meadows Dr
- 123 Homefield Lake Ct
- 1617 Homefield Meadows Dr
- 58 E Homefield Point Ct
- 172 Homefield Gardens Dr
- 176 Homefield Gardens Dr
- 168 Homefield Gardens Dr
- 1615 Homefield Meadows Dr
- 164 Homefield Gardens Dr
- 55 E Homefield Point Ct