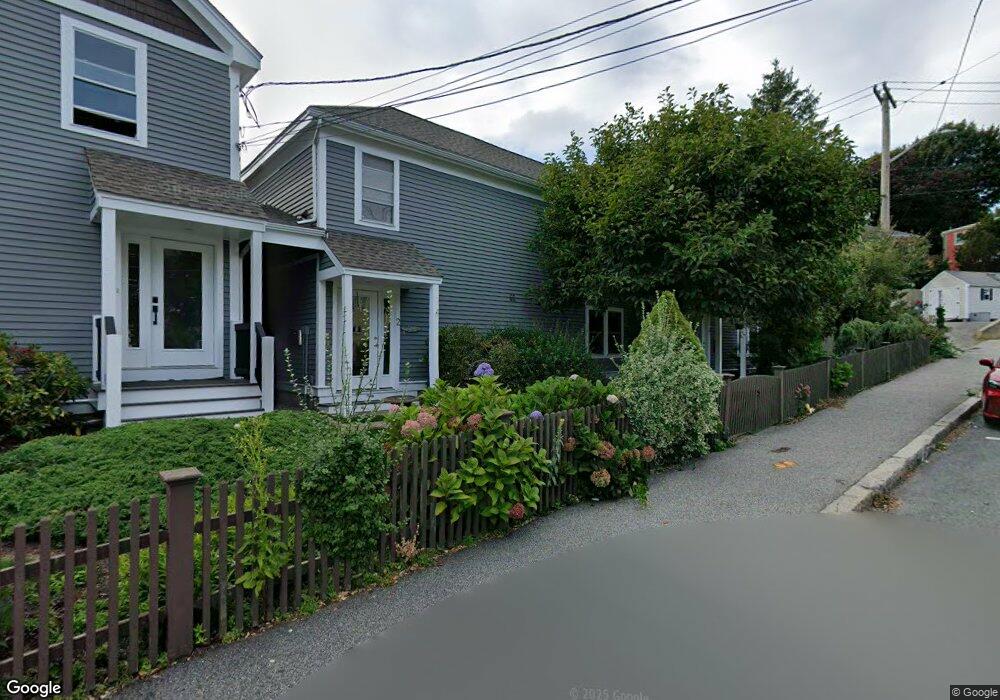
65 E Main St Unit 2-65 Gloucester, MA 01930
East Gloucester NeighborhoodEstimated Value: $639,830 - $834,000
3
Beds
2
Baths
1,680
Sq Ft
$433/Sq Ft
Est. Value
About This Home
This home is located at 65 E Main St Unit 2-65, Gloucester, MA 01930 and is currently estimated at $726,958, approximately $432 per square foot. 65 E Main St Unit 2-65 is a home located in Essex County with nearby schools including East Gloucester Elementary School, Ralph B O'maley Middle School, and Gloucester High School.
Ownership History
Date
Name
Owned For
Owner Type
Purchase Details
Closed on
Apr 15, 2009
Sold by
Mcgivern Stephen J and Mcgivern Krystyna D
Bought by
Mcgivern Tr Stephen J
Current Estimated Value
Purchase Details
Closed on
Jan 29, 2002
Sold by
Bashaw Linda R and Bashaw Russell S
Bought by
Mcgivern Stephen J and Mcgivern Krystyna D
Home Financials for this Owner
Home Financials are based on the most recent Mortgage that was taken out on this home.
Original Mortgage
$440,000
Interest Rate
7.08%
Mortgage Type
Purchase Money Mortgage
Purchase Details
Closed on
Oct 12, 2000
Sold by
Ams Const & Dev Inc
Bought by
Bashaw Linda R and Bashaw Russell S
Home Financials for this Owner
Home Financials are based on the most recent Mortgage that was taken out on this home.
Original Mortgage
$251,750
Interest Rate
7.89%
Mortgage Type
Purchase Money Mortgage
Create a Home Valuation Report for This Property
The Home Valuation Report is an in-depth analysis detailing your home's value as well as a comparison with similar homes in the area
Home Values in the Area
Average Home Value in this Area
Purchase History
| Date | Buyer | Sale Price | Title Company |
|---|---|---|---|
| Mcgivern Tr Stephen J | -- | -- | |
| Mcgivern Stephen J | $315,000 | -- | |
| Bashaw Linda R | $265,000 | -- |
Source: Public Records
Mortgage History
| Date | Status | Borrower | Loan Amount |
|---|---|---|---|
| Previous Owner | Bashaw Linda R | $95,000 | |
| Previous Owner | Bashaw Linda R | $440,000 | |
| Previous Owner | Bashaw Linda R | $255,000 | |
| Previous Owner | Bashaw Linda R | $251,750 |
Source: Public Records
Tax History
| Year | Tax Paid | Tax Assessment Tax Assessment Total Assessment is a certain percentage of the fair market value that is determined by local assessors to be the total taxable value of land and additions on the property. | Land | Improvement |
|---|---|---|---|---|
| 2025 | $5,237 | $538,800 | $0 | $538,800 |
| 2024 | $5,026 | $516,500 | $0 | $516,500 |
| 2023 | $4,822 | $455,300 | $0 | $455,300 |
| 2022 | $4,839 | $412,500 | $0 | $412,500 |
| 2021 | $4,827 | $388,000 | $0 | $388,000 |
| 2020 | $4,671 | $378,800 | $0 | $378,800 |
| 2019 | $4,453 | $350,900 | $0 | $350,900 |
| 2018 | $4,202 | $325,000 | $0 | $325,000 |
| 2017 | $3,973 | $301,200 | $0 | $301,200 |
| 2016 | $3,774 | $277,300 | $0 | $277,300 |
| 2015 | $3,703 | $271,300 | $0 | $271,300 |
Source: Public Records
Map
Nearby Homes
- 3 Mondello Square
- 36 Eastern Ave
- 5 Wise Place
- 197 E Main St Unit 1
- 139A Prospect St
- 26 Marina Dr
- 60 Rocky Neck Ave Unit 202
- 73 Rocky Neck Ave Unit 2
- 191 Main St Unit 3
- 191 Main St Unit 2A
- 19 Trask St Unit 2
- 50 Warner St
- 113 Pleasant St
- 1 Wonson St
- 40 Sargent St
- 33 Maplewood Ave Unit 310
- 35 Middle St Unit 4
- 10 Seaview Rd
- 33 Middle St
- 12 Arthur St
- 65 E Main:winter Unit 1
- 65 E Main St Unit 3
- 65 E Main St Unit 2
- 65 E Main St Unit 1
- 65 E Main St
- 59 E Main St
- 69 E Main St Unit 2
- 9 Wall St
- 55 E Main St
- 54 E Main St
- 69 E Main St Unit 2
- 5 Wall St
- 60 E Main St
- 56 E Main St
- 56 E Main St Unit 2
- 52 E Main St
- 52 E Main St Unit B
- 53 E Main St
- 53 E Main St Unit 3
- 62 E Main St
Your Personal Tour Guide
Ask me questions while you tour the home.