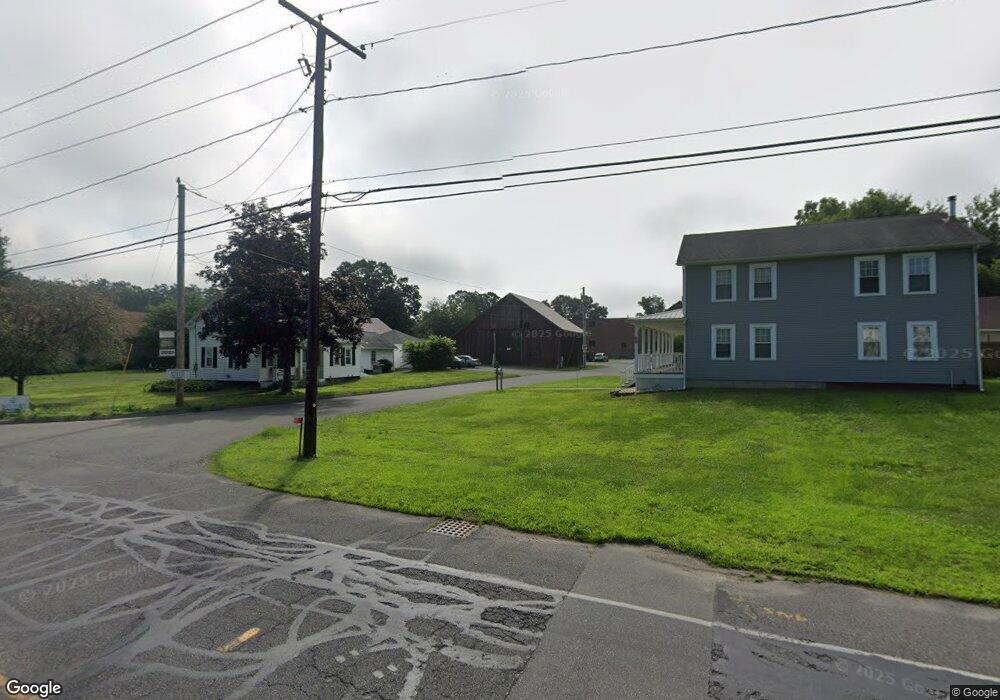
65 Elm St Hatfield, MA 01038
Estimated Value: $463,327 - $657,000
--
Bed
4
Baths
1,491
Sq Ft
$346/Sq Ft
Est. Value
About This Home
This home is located at 65 Elm St, Hatfield, MA 01038 and is currently estimated at $516,082, approximately $346 per square foot. 65 Elm St is a home located in Hampshire County with nearby schools including Hatfield Elementary School, Smith Academy, and The Montessori School of Northampton.
Ownership History
Date
Name
Owned For
Owner Type
Purchase Details
Closed on
Nov 16, 2017
Sold by
Symanski Stanley
Bought by
Tnt Properties Llc
Current Estimated Value
Home Financials for this Owner
Home Financials are based on the most recent Mortgage that was taken out on this home.
Original Mortgage
$335,000
Interest Rate
3.85%
Mortgage Type
Commercial
Purchase Details
Closed on
Jun 13, 2014
Sold by
General Cigar Co Inc
Bought by
Symanski Stanley
Create a Home Valuation Report for This Property
The Home Valuation Report is an in-depth analysis detailing your home's value as well as a comparison with similar homes in the area
Home Values in the Area
Average Home Value in this Area
Purchase History
| Date | Buyer | Sale Price | Title Company |
|---|---|---|---|
| Tnt Properties Llc | $355,000 | -- | |
| Symanski Stanley | $35,000 | -- |
Source: Public Records
Mortgage History
| Date | Status | Borrower | Loan Amount |
|---|---|---|---|
| Previous Owner | Tnt Properties Llc | $335,000 |
Source: Public Records
Tax History
| Year | Tax Paid | Tax Assessment Tax Assessment Total Assessment is a certain percentage of the fair market value that is determined by local assessors to be the total taxable value of land and additions on the property. | Land | Improvement |
|---|---|---|---|---|
| 2025 | $5,496 | $397,100 | $88,000 | $309,100 |
| 2024 | $6,103 | $398,600 | $88,000 | $310,600 |
| 2023 | $5,182 | $384,400 | $88,000 | $296,400 |
| 2022 | $4,991 | $365,100 | $88,000 | $277,100 |
| 2021 | $1,689 | $357,400 | $88,000 | $269,400 |
| 2020 | $4,836 | $357,400 | $88,000 | $269,400 |
| 2019 | $1,653 | $338,600 | $88,000 | $250,600 |
| 2018 | $3,395 | $250,000 | $88,000 | $162,000 |
| 2017 | $3,246 | $245,500 | $88,000 | $157,500 |
| 2016 | $3,216 | $244,000 | $88,000 | $156,000 |
| 2015 | $3,008 | $228,400 | $88,000 | $140,400 |
| 2014 | $16,515 | $1,303,500 | $198,200 | $1,105,300 |
Source: Public Records
Map
Nearby Homes
- 18 Elm St
- 12 Dwight St
- 58 Main St Unit 4
- 58 Main St Unit 3
- 0 N Branch Rd
- 11 West St
- 66 Laurel Park Unit 66
- 26 Russell St Unit A-B
- 32 Stonewall Dr
- 80 Damon Rd Unit 5104
- 80 Damon Rd Unit 4302
- 0 Straits Rd
- 88 Pines Edge Dr Unit 88
- 35 Hubbard Ave
- 289 Hatfield St
- 83 Bay Rd
- 22 Woodbine Ave
- 0 Pantry Rd Unit 73430264
- 20 View Ave Unit A
- 30 View Ave