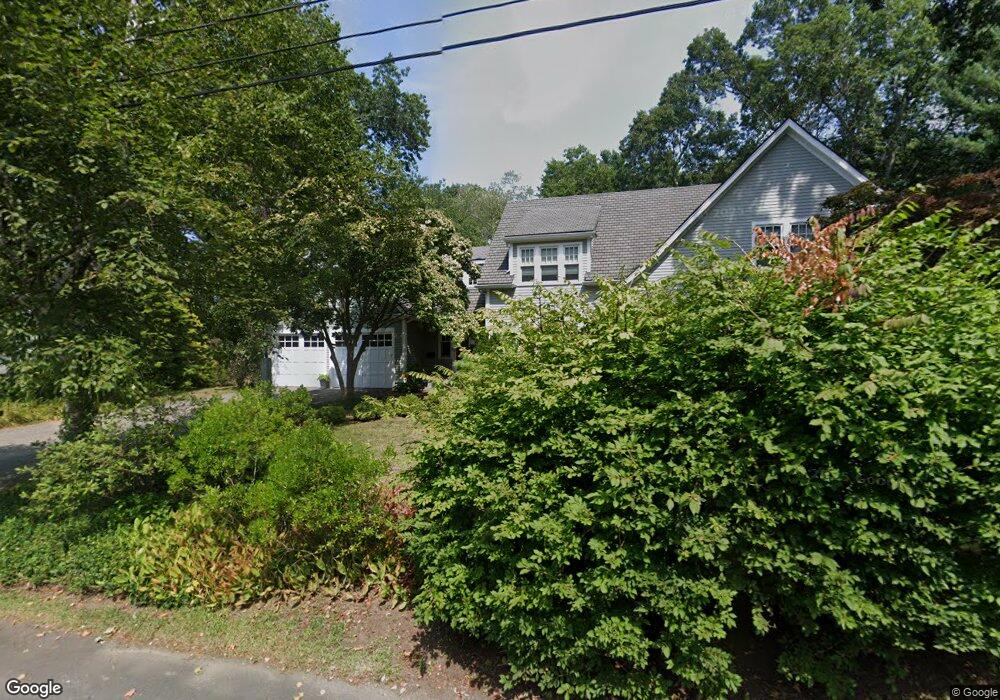
65 Fox Run Rd South Hamilton, MA 01982
Estimated Value: $929,000 - $1,710,000
3
Beds
3
Baths
1,365
Sq Ft
$917/Sq Ft
Est. Value
About This Home
This home is located at 65 Fox Run Rd, South Hamilton, MA 01982 and is currently estimated at $1,252,097, approximately $917 per square foot. 65 Fox Run Rd is a home located in Essex County with nearby schools including Winthrop School, Cutler Elementary School, and Miles River Middle School.
Ownership History
Date
Name
Owned For
Owner Type
Purchase Details
Closed on
Apr 4, 2008
Sold by
Kain John T and Kain Mary Ellen
Bought by
Kain Fox Run T
Current Estimated Value
Home Financials for this Owner
Home Financials are based on the most recent Mortgage that was taken out on this home.
Original Mortgage
$350,000
Outstanding Balance
$218,915
Interest Rate
5.9%
Mortgage Type
Purchase Money Mortgage
Estimated Equity
$1,033,182
Purchase Details
Closed on
Feb 21, 2008
Sold by
Kain Fox Run T
Bought by
Kain John T
Home Financials for this Owner
Home Financials are based on the most recent Mortgage that was taken out on this home.
Original Mortgage
$350,000
Outstanding Balance
$218,915
Interest Rate
5.9%
Mortgage Type
Purchase Money Mortgage
Estimated Equity
$1,033,182
Purchase Details
Closed on
Jan 6, 2006
Sold by
Livesey Ethel Lee Est
Bought by
Kain John
Home Financials for this Owner
Home Financials are based on the most recent Mortgage that was taken out on this home.
Original Mortgage
$364,000
Interest Rate
6.28%
Mortgage Type
Purchase Money Mortgage
Create a Home Valuation Report for This Property
The Home Valuation Report is an in-depth analysis detailing your home's value as well as a comparison with similar homes in the area
Home Values in the Area
Average Home Value in this Area
Purchase History
| Date | Buyer | Sale Price | Title Company |
|---|---|---|---|
| Kain Fox Run T | -- | -- | |
| Kain John T | -- | -- | |
| Kain John | $455,000 | -- |
Source: Public Records
Mortgage History
| Date | Status | Borrower | Loan Amount |
|---|---|---|---|
| Open | Kain John | $350,000 | |
| Previous Owner | Kain John | $200,000 | |
| Previous Owner | Kain John | $364,000 | |
| Previous Owner | Kain John | $68,250 |
Source: Public Records
Tax History Compared to Growth
Tax History
| Year | Tax Paid | Tax Assessment Tax Assessment Total Assessment is a certain percentage of the fair market value that is determined by local assessors to be the total taxable value of land and additions on the property. | Land | Improvement |
|---|---|---|---|---|
| 2025 | $18,429 | $1,177,600 | $356,500 | $821,100 |
| 2024 | $17,481 | $1,156,900 | $356,500 | $800,400 |
| 2023 | $17,441 | $1,067,400 | $319,900 | $747,500 |
| 2022 | $16,763 | $937,500 | $286,100 | $651,400 |
| 2021 | $16,403 | $936,800 | $286,100 | $650,700 |
| 2020 | $15,479 | $911,600 | $286,700 | $624,900 |
| 2019 | $14,656 | $889,300 | $278,300 | $611,000 |
| 2018 | $14,034 | $865,200 | $262,900 | $602,300 |
| 2017 | $14,265 | $848,600 | $245,500 | $603,100 |
| 2016 | $14,145 | $820,000 | $240,900 | $579,100 |
| 2015 | $13,363 | $781,900 | $229,100 | $552,800 |
| 2014 | $13,281 | $763,300 | $228,900 | $534,400 |
Source: Public Records
Map
Nearby Homes