Estimated Value: $2,424,000 - $2,521,632
5
Beds
5
Baths
2,929
Sq Ft
$840/Sq Ft
Est. Value
About This Home
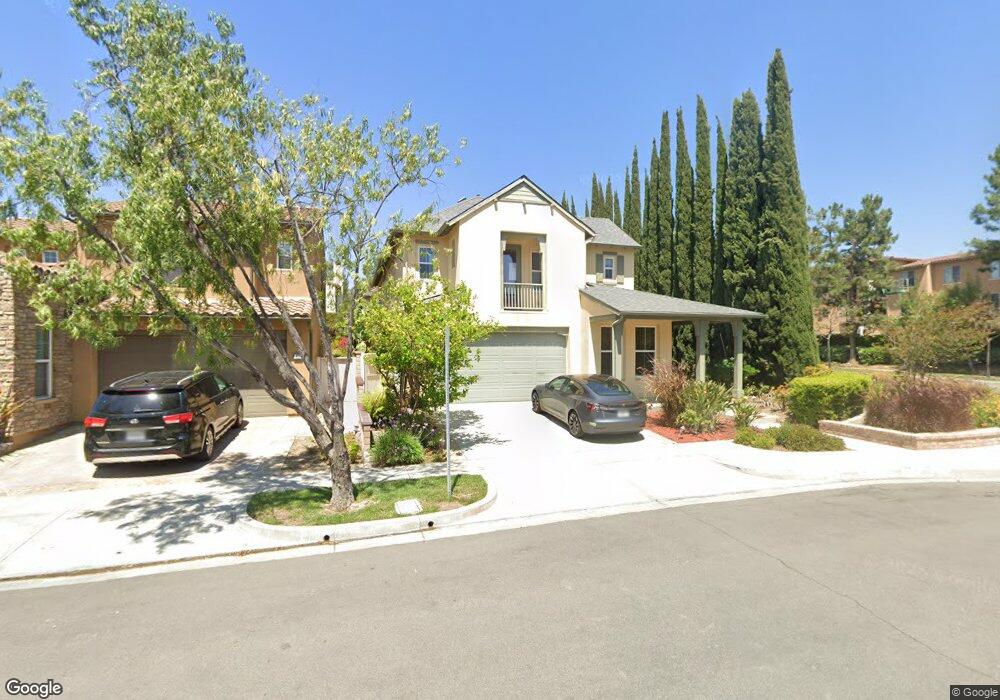
This home is located at 65 Gentry, Irvine, CA 92620 and is currently estimated at $2,461,658, approximately $840 per square foot. 65 Gentry is a home located in Orange County with nearby schools including Jeffrey Trail Middle, Portola High School, and New Horizon Elementary School.
Ownership History
Date
Name
Owned For
Owner Type
Purchase Details
Closed on
Feb 10, 2021
Sold by
Veksler Boris and Veksler Julia
Bought by
Veksler Boris and Veksler Julia
Current Estimated Value
Home Financials for this Owner
Home Financials are based on the most recent Mortgage that was taken out on this home.
Original Mortgage
$624,750
Outstanding Balance
$459,891
Interest Rate
2.7%
Mortgage Type
New Conventional
Estimated Equity
$2,001,767
Purchase Details
Closed on
Dec 20, 2017
Sold by
Veksler Julia and Veksler Boris
Bought by
Veksler Boris S and Veksler Julia
Purchase Details
Closed on
Apr 5, 2005
Sold by
Lennar Homes Of California Inc
Bought by
Lennar Sales Corp
Home Financials for this Owner
Home Financials are based on the most recent Mortgage that was taken out on this home.
Original Mortgage
$778,500
Interest Rate
5.12%
Mortgage Type
Purchase Money Mortgage
Create a Home Valuation Report for This Property
The Home Valuation Report is an in-depth analysis detailing your home's value as well as a comparison with similar homes in the area
Home Values in the Area
Average Home Value in this Area
Purchase History
| Date | Buyer | Sale Price | Title Company |
|---|---|---|---|
| Veksler Boris | -- | Mortgage Connect | |
| Veksler Boris S | -- | Lawyers Title | |
| Lennar Sales Corp | $1,038,000 | North American Title Co |
Source: Public Records
Mortgage History
| Date | Status | Borrower | Loan Amount |
|---|---|---|---|
| Open | Veksler Boris | $624,750 | |
| Previous Owner | Lennar Sales Corp | $778,500 |
Source: Public Records
Tax History
| Year | Tax Paid | Tax Assessment Tax Assessment Total Assessment is a certain percentage of the fair market value that is determined by local assessors to be the total taxable value of land and additions on the property. | Land | Improvement |
|---|---|---|---|---|
| 2025 | $19,187 | $1,446,878 | $855,726 | $591,152 |
| 2024 | $19,187 | $1,418,508 | $838,947 | $579,561 |
| 2023 | $18,799 | $1,390,695 | $822,497 | $568,198 |
| 2022 | $18,474 | $1,363,427 | $806,370 | $557,057 |
| 2021 | $18,165 | $1,336,694 | $790,559 | $546,135 |
| 2020 | $17,931 | $1,322,988 | $782,452 | $540,536 |
| 2019 | $18,326 | $1,297,048 | $767,110 | $529,938 |
| 2018 | $17,291 | $1,200,000 | $680,452 | $519,548 |
| 2017 | $17,775 | $1,246,683 | $737,322 | $509,361 |
| 2016 | $17,728 | $1,222,239 | $722,865 | $499,374 |
| 2015 | $17,500 | $1,203,880 | $712,007 | $491,873 |
| 2014 | $17,256 | $1,180,298 | $698,060 | $482,238 |
Source: Public Records
Map
Nearby Homes
- 123 Chantilly Unit 100
- 120 Gemstone
- 192 Wild Lilac
- 181 Groveland
- 42 Vintage Unit 102
- 109 Sugar Cane
- 50 Vintage
- 5200 Irvine Blvd Unit 497
- 5200 Irvine Blvd
- 5200 Irvine Blvd Unit 123
- 5200 Irvine Blvd Unit 256
- 5200 Irvine Blvd Unit 254
- 5200 Irvine Blvd Unit 360
- 5200 Irvine Blvd Unit 156
- 5200 Irvine Blvd Unit 183
- 5200 Irvine Blvd Unit 54
- 94 Mission
- 230 Shelbourne
- 21 Fanpalm
- 70 City Stroll
Your Personal Tour Guide
Ask me questions while you tour the home.