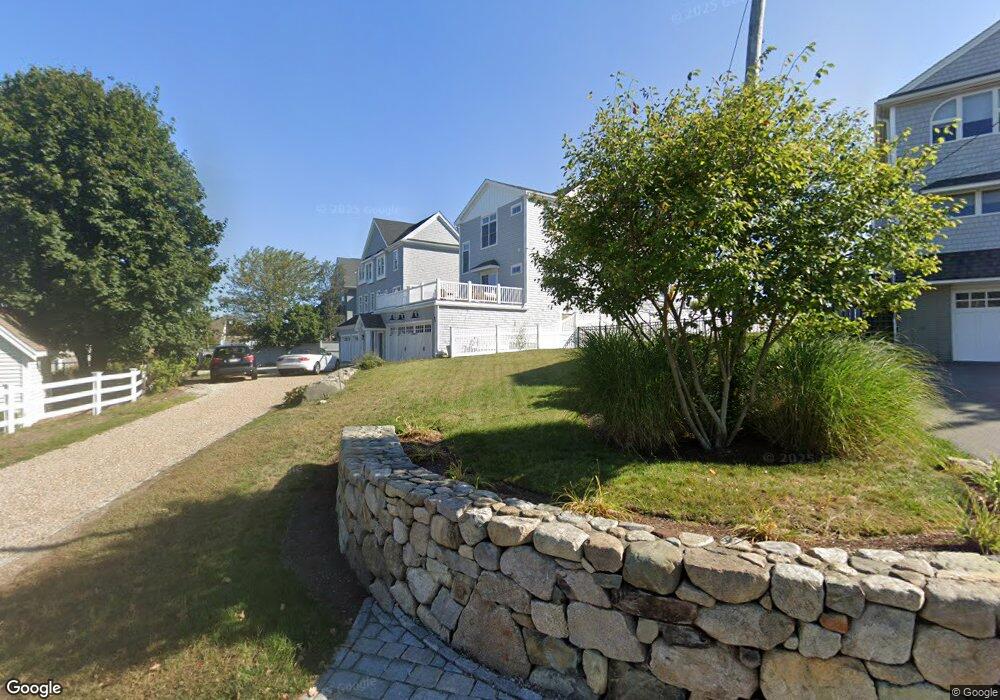
65 Gilson Rd Scituate, MA 02066
Estimated Value: $1,398,000 - $2,126,000
2
Beds
4
Baths
2,088
Sq Ft
$829/Sq Ft
Est. Value
About This Home
This home is located at 65 Gilson Rd, Scituate, MA 02066 and is currently estimated at $1,730,333, approximately $828 per square foot. 65 Gilson Rd is a home located in Plymouth County with nearby schools including Jenkins Elementary School, Lester J. Gates Middle School, and Scituate High School.
Ownership History
Date
Name
Owned For
Owner Type
Purchase Details
Closed on
Oct 19, 2016
Sold by
Dinand John F and Dinand Kathleen
Bought by
Dinand John F and Downes Tammy T
Current Estimated Value
Purchase Details
Closed on
Jul 21, 2016
Sold by
Dinand John and Dinand Kathleen M
Bought by
Dinand Ft and Dinand
Purchase Details
Closed on
Jul 28, 2011
Sold by
Dinand John
Bought by
Dinand John and Dinand Kathleen M
Purchase Details
Closed on
Mar 8, 2004
Sold by
Tibbetts Edward C
Bought by
Tibbetts Richard and Tibbetts Mary
Home Financials for this Owner
Home Financials are based on the most recent Mortgage that was taken out on this home.
Original Mortgage
$270,000
Interest Rate
5.62%
Mortgage Type
Purchase Money Mortgage
Purchase Details
Closed on
Feb 3, 1986
Bought by
Dinand John and Dinand Kathleen M
Create a Home Valuation Report for This Property
The Home Valuation Report is an in-depth analysis detailing your home's value as well as a comparison with similar homes in the area
Home Values in the Area
Average Home Value in this Area
Purchase History
| Date | Buyer | Sale Price | Title Company |
|---|---|---|---|
| Dinand John F | -- | -- | |
| Dinand Ft | -- | -- | |
| Dinand John | -- | -- | |
| Tibbetts Richard | $390,000 | -- | |
| Dinand John | $80,000 | -- |
Source: Public Records
Mortgage History
| Date | Status | Borrower | Loan Amount |
|---|---|---|---|
| Previous Owner | Dinand John | $270,000 | |
| Previous Owner | Dinand John | $152,000 | |
| Previous Owner | Dinand John | $130,000 |
Source: Public Records
Tax History Compared to Growth
Tax History
| Year | Tax Paid | Tax Assessment Tax Assessment Total Assessment is a certain percentage of the fair market value that is determined by local assessors to be the total taxable value of land and additions on the property. | Land | Improvement |
|---|---|---|---|---|
| 2025 | $15,503 | $1,551,900 | $1,152,700 | $399,200 |
| 2024 | $15,721 | $1,517,500 | $1,106,100 | $411,400 |
| 2023 | $15,482 | $1,391,000 | $1,005,600 | $385,400 |
| 2022 | $13,236 | $1,048,800 | $740,900 | $307,900 |
| 2021 | $13,007 | $975,800 | $705,600 | $270,200 |
| 2020 | $10,727 | $794,600 | $581,500 | $213,100 |
| 2019 | $10,633 | $773,900 | $570,100 | $203,800 |
| 2018 | $10,555 | $756,600 | $568,600 | $188,000 |
| 2017 | $9,335 | $662,500 | $481,800 | $180,700 |
| 2016 | $9,273 | $655,800 | $475,100 | $180,700 |
| 2015 | $7,978 | $609,000 | $428,300 | $180,700 |
Source: Public Records
Map
Nearby Homes
- 2 Collier Rd
- 59 Greenfield Ln
- 37 Moorland Rd
- 12 Meeting House Ln Unit 308
- 67 Greenfield Ln
- 48 Moorland Rd
- 50 First Parish Rd
- 91 Front St Unit 106
- 23 Sunset Rd
- 76 A Brook St
- 76 A Brook St Unit 1
- 29 Ladds Way Unit 29
- 74 Tilden Rd
- 19 Ford Place Unit 3
- 19 Ford Place Unit 1
- 19 Ford Place Unit 4
- 32 Barker Rd Unit 3
- 146 Chief Justice Cushing Hwy
- 12 Richfield Rd
- 12 Sassamon Rd