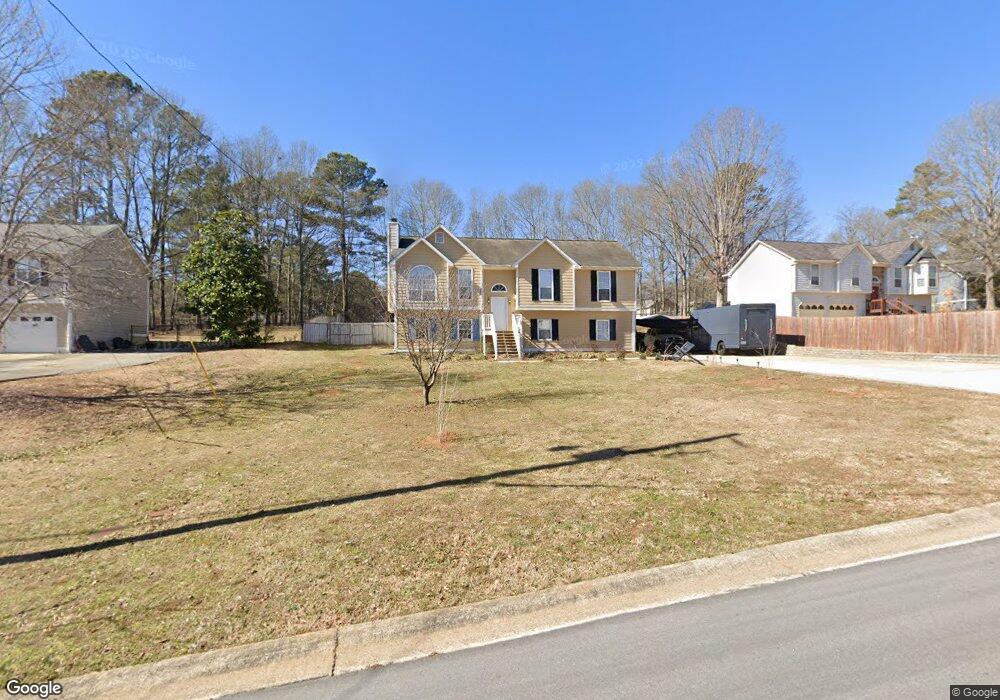
65 Grapevine Dr Douglasville, GA 30134
Estimated Value: $244,000 - $291,000
3
Beds
2
Baths
1,262
Sq Ft
$210/Sq Ft
Est. Value
About This Home
This home is located at 65 Grapevine Dr, Douglasville, GA 30134 and is currently estimated at $265,273, approximately $210 per square foot. 65 Grapevine Dr is a home located in Paulding County with nearby schools including Connie Dugan Elementary School, Irma C. Austin Middle School, and South Paulding High School.
Ownership History
Date
Name
Owned For
Owner Type
Purchase Details
Closed on
Jan 29, 2010
Sold by
Hud & Housing Of Urban Dev
Bought by
Tiron Iryna
Current Estimated Value
Home Financials for this Owner
Home Financials are based on the most recent Mortgage that was taken out on this home.
Original Mortgage
$72,538
Outstanding Balance
$48,817
Interest Rate
5.37%
Mortgage Type
FHA
Estimated Equity
$216,456
Purchase Details
Closed on
Jul 7, 2009
Sold by
Suntrust Mortgage Inc
Bought by
Hud-Housing Of Urban Dev
Purchase Details
Closed on
Oct 30, 2003
Sold by
Payne Clinton S
Bought by
Ables George and Ables Tamara
Home Financials for this Owner
Home Financials are based on the most recent Mortgage that was taken out on this home.
Original Mortgage
$105,000
Interest Rate
6%
Mortgage Type
FHA
Create a Home Valuation Report for This Property
The Home Valuation Report is an in-depth analysis detailing your home's value as well as a comparison with similar homes in the area
Home Values in the Area
Average Home Value in this Area
Purchase History
| Date | Buyer | Sale Price | Title Company |
|---|---|---|---|
| Tiron Iryna | $67,750 | -- | |
| Hud-Housing Of Urban Dev | -- | -- | |
| Suntrust Mtg Inc | $105,222 | -- | |
| Ables George | $106,700 | -- |
Source: Public Records
Mortgage History
| Date | Status | Borrower | Loan Amount |
|---|---|---|---|
| Open | Tiron Iryna | $72,538 | |
| Previous Owner | Ables George | $105,000 |
Source: Public Records
Tax History Compared to Growth
Tax History
| Year | Tax Paid | Tax Assessment Tax Assessment Total Assessment is a certain percentage of the fair market value that is determined by local assessors to be the total taxable value of land and additions on the property. | Land | Improvement |
|---|---|---|---|---|
| 2024 | $2,805 | $116,008 | $12,000 | $104,008 |
| 2023 | $2,973 | $116,568 | $12,000 | $104,568 |
| 2022 | $2,209 | $86,624 | $12,000 | $74,624 |
| 2021 | $1,373 | $49,100 | $8,000 | $41,100 |
| 2020 | $1,558 | $54,296 | $8,000 | $46,296 |
| 2019 | $1,621 | $53,792 | $8,000 | $45,792 |
| 2018 | $1,393 | $46,240 | $8,000 | $38,240 |
| 2017 | $1,176 | $38,488 | $8,000 | $30,488 |
| 2016 | $1,065 | $35,232 | $8,000 | $27,232 |
| 2015 | $1,089 | $35,396 | $8,000 | $27,396 |
| 2014 | $933 | $29,564 | $8,000 | $21,564 |
| 2013 | -- | $17,760 | $6,000 | $11,760 |
Source: Public Records
Map
Nearby Homes
- 1517 Winn Rd
- 170 Sandstone Place
- 76 Riverbend Trail
- 199 River Walk
- 227 Bridge Landing
- 156 Brookridge Ct
- 246 Hudson Cir
- 200 Brookwood Crossing
- 370 Cassidy Trail
- 624 Silverthorne Cir
- 580 Bridge Landing
- 391 Hudson Cir
- 896 Winn Rd
- 534 Winn Rd
- 1150 Denton Rd Unit 371
- 1150 Denton Rd
- 1050 Denton Rd
- 65 Ridgefield Dr
- 71 Grapevine Dr Unit 2
- 39 Grapevine Dr
- 1149 Cohran Store Rd Unit 1
- 1133 Cohran Store Rd
- 35 Brandywine Dr
- 66 Grapevine Dr
- 57 Brandywine Dr
- 85 Grapevine Dr
- 1111 Cohran Store Rd Unit 1
- 1169 Cohran Store Rd
- 24 Grapevine Dr
- 87 Grapevine Dr
- 122 Grapevine Dr
- 1095 Cohran Store Rd
- 91 Grapevine Dr
- 0 Cohran Store Rd Unit 7107033
- 0 Cohran Store Rd Unit 3191695
- 0 Cohran Store Rd Unit 8827991
- 0 Cohran Store Rd Unit 8633172
- 0 Cohran Store Rd Unit 8572299