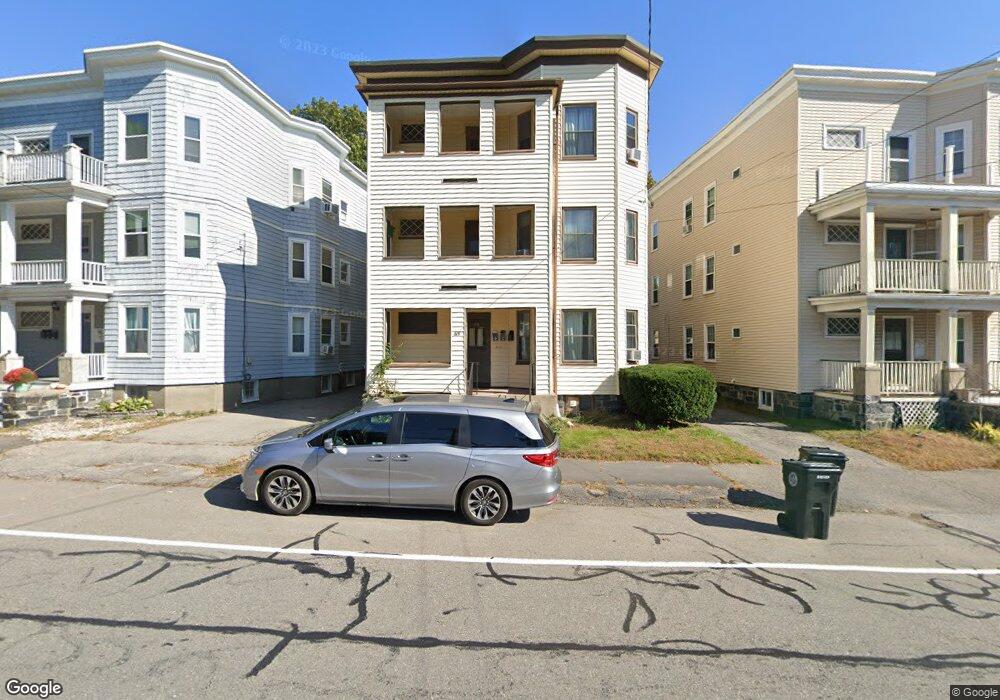
65 Grove St Belmont, MA 02478
Cushing Square NeighborhoodEstimated Value: $1,236,726 - $1,495,000
6
Beds
3
Baths
3,876
Sq Ft
$354/Sq Ft
Est. Value
About This Home
This home is located at 65 Grove St, Belmont, MA 02478 and is currently estimated at $1,371,932, approximately $353 per square foot. 65 Grove St is a home located in Middlesex County with nearby schools including Roger Wellington Elementary School, Winthrop L Chenery Middle School, and Belmont High School.
Ownership History
Date
Name
Owned For
Owner Type
Purchase Details
Closed on
Jan 26, 2022
Sold by
Brown James G
Bought by
65 Grove Street Rt and Brown
Current Estimated Value
Purchase Details
Closed on
Nov 12, 2021
Sold by
65 Grove Street Rt and Brown
Bought by
Brown James G
Home Financials for this Owner
Home Financials are based on the most recent Mortgage that was taken out on this home.
Original Mortgage
$500,000
Interest Rate
3.05%
Mortgage Type
Credit Line Revolving
Purchase Details
Closed on
May 1, 2009
Sold by
Yerardi Rose M
Bought by
Brown James G
Home Financials for this Owner
Home Financials are based on the most recent Mortgage that was taken out on this home.
Original Mortgage
$393,750
Interest Rate
4.86%
Mortgage Type
Purchase Money Mortgage
Create a Home Valuation Report for This Property
The Home Valuation Report is an in-depth analysis detailing your home's value as well as a comparison with similar homes in the area
Home Values in the Area
Average Home Value in this Area
Purchase History
| Date | Buyer | Sale Price | Title Company |
|---|---|---|---|
| 65 Grove Street Rt | -- | None Available | |
| 65 Grove Street Rt | -- | None Available | |
| Brown James G | -- | None Available | |
| Brown James G | -- | None Available | |
| Brown James G | $525,000 | -- | |
| Brown James G | $525,000 | -- |
Source: Public Records
Mortgage History
| Date | Status | Borrower | Loan Amount |
|---|---|---|---|
| Previous Owner | Brown James G | $500,000 | |
| Previous Owner | Brown James G | $393,750 | |
| Previous Owner | Brown James G | $145,000 |
Source: Public Records
Tax History Compared to Growth
Tax History
| Year | Tax Paid | Tax Assessment Tax Assessment Total Assessment is a certain percentage of the fair market value that is determined by local assessors to be the total taxable value of land and additions on the property. | Land | Improvement |
|---|---|---|---|---|
| 2025 | $13,520 | $1,187,000 | $582,000 | $605,000 |
| 2024 | $13,570 | $1,285,000 | $798,000 | $487,000 |
| 2023 | $13,409 | $1,193,000 | $752,000 | $441,000 |
| 2022 | $12,704 | $1,099,000 | $688,000 | $411,000 |
| 2021 | $12,082 | $1,047,000 | $682,000 | $365,000 |
| 2020 | $10,857 | $987,000 | $549,000 | $438,000 |
| 2019 | $10,725 | $919,000 | $446,000 | $473,000 |
| 2018 | $10,364 | $853,000 | $386,000 | $467,000 |
| 2017 | $8,985 | $708,000 | $319,000 | $389,000 |
| 2016 | $8,842 | $704,000 | $319,000 | $385,000 |
| 2015 | $7,572 | $587,000 | $284,000 | $303,000 |
Source: Public Records
Map
Nearby Homes
- 73 Foster Rd Unit 2
- 30 Unity Ave Unit 30
- 10 Marlboro St Unit 1
- 163 Belmont St
- 276 Belmont St Unit 1
- 147 Langdon Ave Unit 149
- 133 Hillside Rd
- 16 Ericsson St
- 87 Templeton Pkwy Unit 3
- 56-58 Edgecliff Rd
- 161 Cushing St
- 95 Cushing St
- 25 Francis St Unit 2
- 25 Francis St Unit 1
- 81 Winsor Ave
- 66 Holworthy St
- 87 Holworthy St Unit 2
- 87 Holworthy St Unit 3
- 43 Irma Ave Unit 43
- 1 Clayton St
- 69 Grove St
- 61 Grove St
- 61 Grove St Unit 2
- 61 Grove St Unit 1
- 57 Grove St
- 73 Grove St
- 58 Berwick St
- 58 Berwick St Unit 1
- 56 Berwick St Unit 3
- 56 Berwick St Unit 2
- 56 Berwick St Unit 1
- 62 Berwick St
- 62 Berwick St
- 62 Berwick St Unit 1
- 60 Berwick St
- 75 Grove St Unit 77
- 51 Grove St
- 56 Grove St Unit 58
- 48 Fairview Ave
- 54 Park Rd