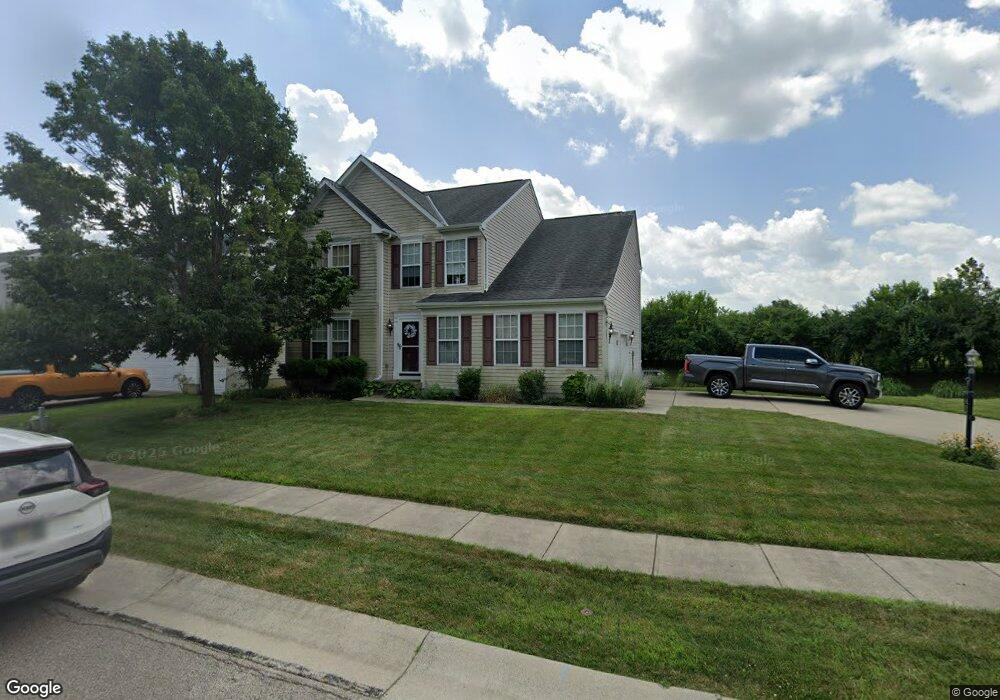
65 Hancock Cove Franklin, OH 45005
Estimated Value: $341,000 - $392,270
4
Beds
4
Baths
3,792
Sq Ft
$99/Sq Ft
Est. Value
About This Home
This home is located at 65 Hancock Cove, Franklin, OH 45005 and is currently estimated at $374,068, approximately $98 per square foot. 65 Hancock Cove is a home located in Warren County with nearby schools including Franklin High School, Summit Academy Community School for Alternative Learners - Middletown, and St. John XXIII Catholic School.
Ownership History
Date
Name
Owned For
Owner Type
Purchase Details
Closed on
Feb 9, 2009
Sold by
Bank Of New York
Bought by
Whelan Kevin
Current Estimated Value
Home Financials for this Owner
Home Financials are based on the most recent Mortgage that was taken out on this home.
Original Mortgage
$112,000
Interest Rate
5.09%
Mortgage Type
Purchase Money Mortgage
Purchase Details
Closed on
Aug 6, 2008
Sold by
Jeffery Trevor L and Case #08Cv70618
Bought by
The Bank Of New York
Purchase Details
Closed on
Dec 22, 2004
Sold by
Nvr Inc
Bought by
Jeffery Trever L
Home Financials for this Owner
Home Financials are based on the most recent Mortgage that was taken out on this home.
Original Mortgage
$181,900
Interest Rate
5.99%
Mortgage Type
Purchase Money Mortgage
Purchase Details
Closed on
Aug 25, 2004
Sold by
Hdc Iii Llc
Bought by
Nvr Inc
Create a Home Valuation Report for This Property
The Home Valuation Report is an in-depth analysis detailing your home's value as well as a comparison with similar homes in the area
Home Values in the Area
Average Home Value in this Area
Purchase History
| Date | Buyer | Sale Price | Title Company |
|---|---|---|---|
| Whelan Kevin | $140,000 | Thoroughbred Title | |
| The Bank Of New York | $150,000 | None Available | |
| Jeffery Trever L | $227,400 | -- | |
| Nvr Inc | $23,500 | First Title Agency Inc |
Source: Public Records
Mortgage History
| Date | Status | Borrower | Loan Amount |
|---|---|---|---|
| Previous Owner | Whelan Kevin | $112,000 | |
| Previous Owner | Jeffery Trever L | $181,900 | |
| Closed | Jeffery Trever L | $45,400 |
Source: Public Records
Tax History Compared to Growth
Tax History
| Year | Tax Paid | Tax Assessment Tax Assessment Total Assessment is a certain percentage of the fair market value that is determined by local assessors to be the total taxable value of land and additions on the property. | Land | Improvement |
|---|---|---|---|---|
| 2024 | $5,132 | $106,590 | $24,500 | $82,090 |
| 2023 | $4,593 | $85,655 | $12,915 | $72,740 |
| 2022 | $4,504 | $85,656 | $12,915 | $72,741 |
| 2021 | $4,269 | $85,656 | $12,915 | $72,741 |
| 2020 | $3,934 | $69,640 | $10,500 | $59,140 |
| 2019 | $3,586 | $69,640 | $10,500 | $59,140 |
| 2018 | $3,538 | $69,640 | $10,500 | $59,140 |
| 2017 | $3,363 | $59,672 | $8,320 | $51,352 |
| 2016 | $3,429 | $59,672 | $8,320 | $51,352 |
| 2015 | $3,429 | $59,672 | $8,320 | $51,352 |
| 2014 | $3,373 | $57,940 | $8,080 | $49,860 |
| 2013 | $2,909 | $75,290 | $10,500 | $64,790 |
Source: Public Records
Map
Nearby Homes
- 60 Pleasant Hill Blvd
- 220 Pleasant Hill Blvd
- 25 Timber Creek Dr
- 5756 Union Rd
- 5845 Manchester Rd
- 0 Kathy Ln Unit 1834240
- 0 Kathy Ln Unit 930066
- 5696 Woodcreek Dr
- 6772 Rivulet Dr
- 5714 Millbrook Dr
- 5667 Woodcreek Dr
- 1117 S Main St
- 5760 Autumn Dr
- 1010 S Main St
- 6777 Crystal Harbour Dr
- 7 Brown St
- 6795 Crystal Harbour Dr
- 1007 S River St
- 218 Roberts Ave
- 5019 Waterford Ln
- 45 Hancock Cove
- 35 Hancock Cove
- 62 Hancock Cove
- 72 Hancock Cove
- 52 Hancock Cove
- 71 Pleasant Hill Blvd
- 75 Hancock Cove
- 61 Pleasant Hill Blvd
- 42 Hancock Cove
- 25 Hancock Cove
- 82 Hancock Cove
- 32 Hancock Cove
- 15 Hancock Cove
- 22 Hancock Cove
- 111 Pleasant Hill Blvd
- 70 Pleasant Hill Blvd
- 12 Hancock Cove
- 80 Pleasant Hill Blvd
- 121 Pleasant Hill Blvd
- 50 Pleasant Hill Blvd