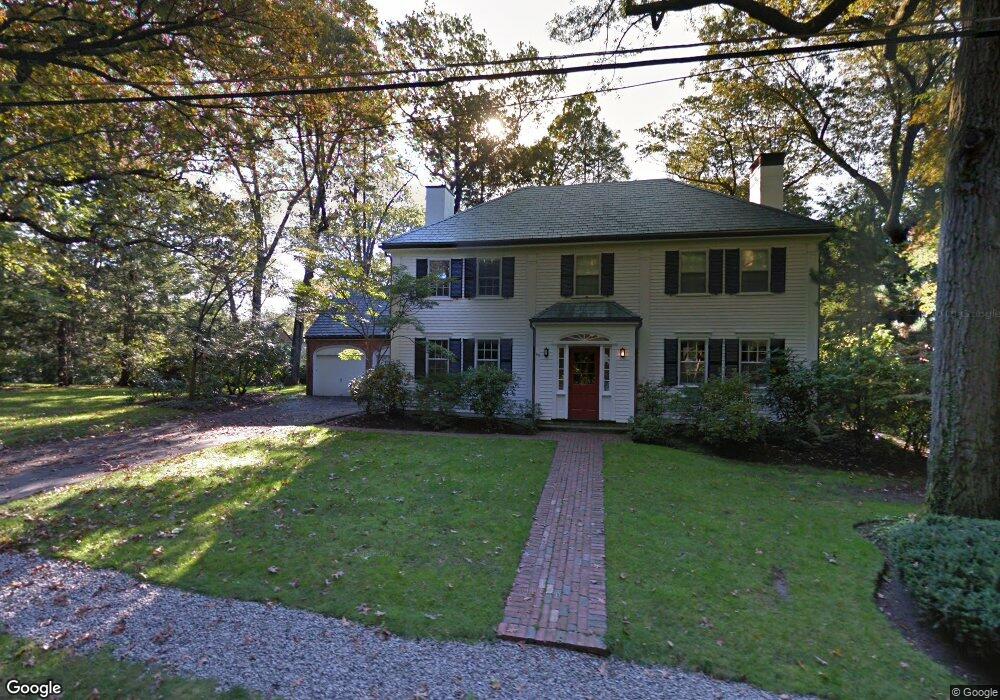
65 Howland Rd West Newton, MA 02465
West Newton NeighborhoodEstimated Value: $2,337,270 - $2,832,000
5
Beds
4
Baths
2,364
Sq Ft
$1,103/Sq Ft
Est. Value
About This Home
This home is located at 65 Howland Rd, West Newton, MA 02465 and is currently estimated at $2,607,568, approximately $1,103 per square foot. 65 Howland Rd is a home located in Middlesex County with nearby schools including Peirce Elementary School, F.A. Day Middle School, and Newton North High School.
Ownership History
Date
Name
Owned For
Owner Type
Purchase Details
Closed on
Apr 30, 2013
Sold by
Noseworthy Peter A and Ruddy Kathryn J
Bought by
Lubitz Steven A and Lubitz Carrie C
Current Estimated Value
Home Financials for this Owner
Home Financials are based on the most recent Mortgage that was taken out on this home.
Original Mortgage
$936,000
Outstanding Balance
$665,751
Interest Rate
3.64%
Mortgage Type
Purchase Money Mortgage
Estimated Equity
$1,941,817
Purchase Details
Closed on
Nov 19, 2010
Sold by
Feffer Richard J and Feffer Janice L
Bought by
Noseworthy Peter A and Ruddy Kathryn J
Home Financials for this Owner
Home Financials are based on the most recent Mortgage that was taken out on this home.
Original Mortgage
$681,250
Interest Rate
4.3%
Mortgage Type
Purchase Money Mortgage
Create a Home Valuation Report for This Property
The Home Valuation Report is an in-depth analysis detailing your home's value as well as a comparison with similar homes in the area
Home Values in the Area
Average Home Value in this Area
Purchase History
| Date | Buyer | Sale Price | Title Company |
|---|---|---|---|
| Lubitz Steven A | $1,170,000 | -- | |
| Lubitz Steven A | $1,170,000 | -- | |
| Noseworthy Peter A | $981,250 | -- |
Source: Public Records
Mortgage History
| Date | Status | Borrower | Loan Amount |
|---|---|---|---|
| Open | Lubitz Steven A | $936,000 | |
| Closed | Lubitz Steven A | $936,000 | |
| Previous Owner | Noseworthy Peter A | $681,250 |
Source: Public Records
Tax History Compared to Growth
Tax History
| Year | Tax Paid | Tax Assessment Tax Assessment Total Assessment is a certain percentage of the fair market value that is determined by local assessors to be the total taxable value of land and additions on the property. | Land | Improvement |
|---|---|---|---|---|
| 2025 | $22,543 | $2,300,300 | $1,296,000 | $1,004,300 |
| 2024 | $21,797 | $2,233,300 | $1,258,300 | $975,000 |
| 2023 | $20,919 | $2,054,900 | $980,200 | $1,074,700 |
| 2022 | $20,016 | $1,902,700 | $907,600 | $995,100 |
| 2021 | $19,678 | $1,828,800 | $856,200 | $972,600 |
| 2020 | $19,093 | $1,828,800 | $856,200 | $972,600 |
| 2019 | $18,554 | $1,775,500 | $831,300 | $944,200 |
| 2018 | $17,317 | $1,600,500 | $752,200 | $848,300 |
| 2017 | $14,460 | $1,300,400 | $709,600 | $590,800 |
| 2016 | $13,830 | $1,215,300 | $663,200 | $552,100 |
| 2015 | $13,187 | $1,135,800 | $619,800 | $516,000 |
Source: Public Records
Map
Nearby Homes
- 39 Valentine Park
- 308 Prince St
- 222 Prince St
- 70 Bigelow Rd
- 46 Ellis Rd
- 279 Chestnut St
- 1230 Commonwealth Ave
- 36 Troy Ln
- 18 Sewall St
- 4 Hosmer Cir
- 443 Chestnut St
- 154 Beaumont Ave
- 10 Ruane Rd
- 61 Lakeview Ave
- 318 Austin St Unit A
- 79 Chestnut St Unit 2
- 479 Chestnut St
- 12 Inis Cir
- 33 Birch Hill Rd
- 513 Chestnut St