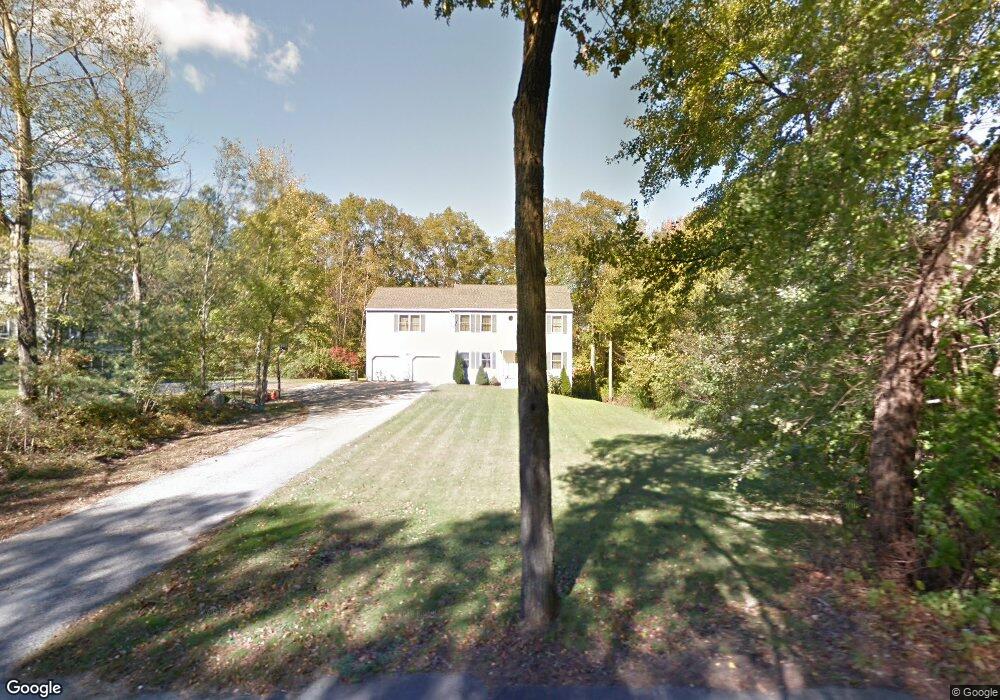
65 Klebart Ave Webster, MA 01570
Estimated Value: $514,000 - $568,000
4
Beds
3
Baths
2,480
Sq Ft
$217/Sq Ft
Est. Value
About This Home
This home is located at 65 Klebart Ave, Webster, MA 01570 and is currently estimated at $537,623, approximately $216 per square foot. 65 Klebart Ave is a home located in Worcester County with nearby schools including Park Avenue Elementary School, Webster Middle School, and Bartlett High School.
Ownership History
Date
Name
Owned For
Owner Type
Purchase Details
Closed on
Oct 14, 2020
Sold by
Kibaru Martha W
Bought by
Kibaru Martha W and Karanja Francis K
Current Estimated Value
Home Financials for this Owner
Home Financials are based on the most recent Mortgage that was taken out on this home.
Original Mortgage
$217,600
Outstanding Balance
$191,411
Interest Rate
2.8%
Mortgage Type
New Conventional
Estimated Equity
$346,212
Purchase Details
Closed on
Jun 15, 2005
Sold by
Waithaka Martha W
Bought by
Karanja Francis
Home Financials for this Owner
Home Financials are based on the most recent Mortgage that was taken out on this home.
Original Mortgage
$254,000
Interest Rate
5.78%
Mortgage Type
Purchase Money Mortgage
Purchase Details
Closed on
Nov 1, 2001
Sold by
Kapuscinska Iwona and Ossowski Stanislaw
Bought by
Waithaka Martha W
Create a Home Valuation Report for This Property
The Home Valuation Report is an in-depth analysis detailing your home's value as well as a comparison with similar homes in the area
Home Values in the Area
Average Home Value in this Area
Purchase History
| Date | Buyer | Sale Price | Title Company |
|---|---|---|---|
| Kibaru Martha W | -- | None Available | |
| Karanja Francis | $317,500 | -- | |
| Karanja Francis | $317,500 | -- | |
| Waithaka Martha W | $41,500 | -- |
Source: Public Records
Mortgage History
| Date | Status | Borrower | Loan Amount |
|---|---|---|---|
| Open | Kibaru Martha W | $217,600 | |
| Previous Owner | Karanja Francis | $254,000 |
Source: Public Records
Tax History
| Year | Tax Paid | Tax Assessment Tax Assessment Total Assessment is a certain percentage of the fair market value that is determined by local assessors to be the total taxable value of land and additions on the property. | Land | Improvement |
|---|---|---|---|---|
| 2025 | $5,489 | $462,000 | $63,000 | $399,000 |
| 2024 | $5,414 | $444,500 | $60,600 | $383,900 |
| 2023 | $4,984 | $398,700 | $57,700 | $341,000 |
| 2022 | $4,939 | $353,800 | $56,000 | $297,800 |
| 2021 | $4,903 | $324,700 | $56,000 | $268,700 |
| 2020 | $4,940 | $328,000 | $56,000 | $272,000 |
| 2019 | $4,735 | $308,900 | $56,000 | $252,900 |
| 2018 | $4,679 | $304,000 | $56,000 | $248,000 |
| 2017 | $4,317 | $285,300 | $54,800 | $230,500 |
| 2016 | $4,058 | $268,000 | $54,800 | $213,200 |
| 2015 | $3,895 | $265,300 | $53,800 | $211,500 |
Source: Public Records
Map
Nearby Homes
Your Personal Tour Guide
Ask me questions while you tour the home.