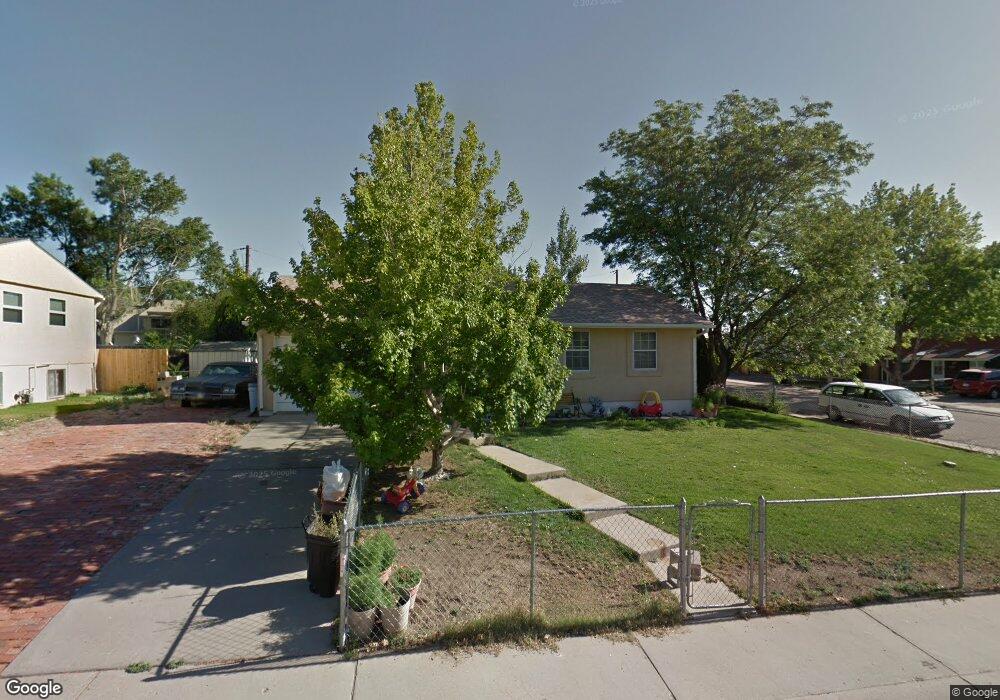
65 Macgregor Rd Pueblo, CO 81001
Belmont NeighborhoodEstimated Value: $212,375 - $247,000
2
Beds
1
Bath
863
Sq Ft
$266/Sq Ft
Est. Value
About This Home
This home is located at 65 Macgregor Rd, Pueblo, CO 81001 and is currently estimated at $229,594, approximately $266 per square foot. 65 Macgregor Rd is a home located in Pueblo County with nearby schools including Franklin School of Innovation, Heaton Middle School, and East High School.
Ownership History
Date
Name
Owned For
Owner Type
Purchase Details
Closed on
Aug 11, 2005
Sold by
Perez Ralph
Bought by
Perez Ralph
Current Estimated Value
Purchase Details
Closed on
Jul 20, 2004
Sold by
Lee Charlene E
Bought by
Perez Ralph
Purchase Details
Closed on
Dec 6, 2001
Sold by
Alire Charlene E
Bought by
Lee Charlene E
Purchase Details
Closed on
Feb 27, 1992
Sold by
Alire Raymond R + Charlene E
Bought by
Alire Charlene E
Purchase Details
Closed on
Feb 25, 1983
Sold by
Matuzak R J + B E
Bought by
Alire Raymond R + Charlene E
Purchase Details
Closed on
Feb 14, 1979
Sold by
Same
Bought by
Matuzak R J + B E
Purchase Details
Closed on
Jan 23, 1970
Bought by
D+F Const Company
Create a Home Valuation Report for This Property
The Home Valuation Report is an in-depth analysis detailing your home's value as well as a comparison with similar homes in the area
Home Values in the Area
Average Home Value in this Area
Purchase History
| Date | Buyer | Sale Price | Title Company |
|---|---|---|---|
| Perez Ralph | -- | -- | |
| Perez Ralph | -- | -- | |
| Lee Charlene E | -- | -- | |
| Alire Charlene E | -- | -- | |
| Alire Raymond R + Charlene E | $50,000 | -- | |
| Matuzak R J + B E | $36,500 | -- | |
| D+F Const Company | $10,000 | -- |
Source: Public Records
Tax History
| Year | Tax Paid | Tax Assessment Tax Assessment Total Assessment is a certain percentage of the fair market value that is determined by local assessors to be the total taxable value of land and additions on the property. | Land | Improvement |
|---|---|---|---|---|
| 2024 | $1,067 | $10,860 | -- | -- |
| 2023 | $1,079 | $14,550 | $1,340 | $13,210 |
| 2022 | $1,074 | $10,820 | $1,390 | $9,430 |
| 2021 | $1,108 | $11,130 | $1,430 | $9,700 |
| 2020 | $916 | $11,130 | $1,430 | $9,700 |
| 2019 | $915 | $9,063 | $697 | $8,366 |
| 2018 | $669 | $7,386 | $702 | $6,684 |
| 2017 | $676 | $7,386 | $702 | $6,684 |
| 2016 | $657 | $7,229 | $776 | $6,453 |
| 2015 | $654 | $7,229 | $776 | $6,453 |
| 2014 | $637 | $7,026 | $776 | $6,250 |
Source: Public Records
Map
Nearby Homes
- 53 Macgregor Rd
- 72 Hanson Ln
- 37 Massari Rd
- 96 Gamble Ln
- 160 Gamble Ln
- 162 Gamble Ln Unit M
- 18 Macgregor Rd
- 1901 Constitution Rd Unit 16
- 1901 Constitution Rd Unit 33
- 1602 Constitution Rd
- 38 Macalester Rd
- 7 Briargate Terrace
- 45 Belvista Ct
- 8 Churchill Rd
- TBD Carefree Ln
- 2101 N Queens Ave
- 33 Briargate Terrace
- 1529 Oakshire Ln
- 1535 Alexander Cir
- TBD 002 Oakshire Ln
Your Personal Tour Guide
Ask me questions while you tour the home.