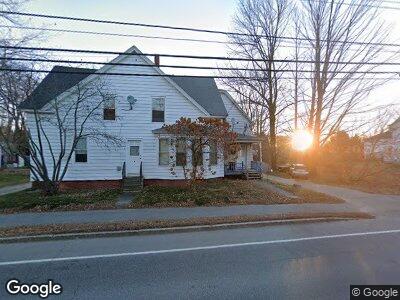
65 Main St Topsham, ME 04086
Estimated Value: $394,000 - $489,000
5
Beds
3
Baths
2,500
Sq Ft
$182/Sq Ft
Est. Value
About This Home
This home is located at 65 Main St, Topsham, ME 04086 and is currently estimated at $454,333, approximately $181 per square foot. 65 Main St is a home located in Sagadahoc County with nearby schools including Mt Ararat High School, Harpswell Coastal Academy Divisions 2 and 3, and St. John's Catholic School.
Ownership History
Date
Name
Owned For
Owner Type
Purchase Details
Closed on
May 15, 2008
Sold by
Goodenow Cindy L
Bought by
Burgess Marsha L and Charron David W
Current Estimated Value
Home Financials for this Owner
Home Financials are based on the most recent Mortgage that was taken out on this home.
Original Mortgage
$187,852
Interest Rate
5.91%
Mortgage Type
FHA
Create a Home Valuation Report for This Property
The Home Valuation Report is an in-depth analysis detailing your home's value as well as a comparison with similar homes in the area
Home Values in the Area
Average Home Value in this Area
Purchase History
| Date | Buyer | Sale Price | Title Company |
|---|---|---|---|
| Burgess Marsha L | -- | -- |
Source: Public Records
Mortgage History
| Date | Status | Borrower | Loan Amount |
|---|---|---|---|
| Open | Dunlap Julianne | $123,750 | |
| Closed | Dunlop Julianne | $187,852 | |
| Previous Owner | Dunlop Julianne | $14,919 | |
| Previous Owner | Dunlop Julianne | $12,100 |
Source: Public Records
Tax History Compared to Growth
Tax History
| Year | Tax Paid | Tax Assessment Tax Assessment Total Assessment is a certain percentage of the fair market value that is determined by local assessors to be the total taxable value of land and additions on the property. | Land | Improvement |
|---|---|---|---|---|
| 2024 | $3,750 | $300,000 | $51,000 | $249,000 |
| 2023 | $3,604 | $265,400 | $48,500 | $216,900 |
| 2022 | $3,465 | $240,300 | $46,900 | $193,400 |
| 2021 | $3,379 | $212,900 | $43,000 | $169,900 |
| 2020 | $3,524 | $197,300 | $43,000 | $154,300 |
| 2019 | $3,629 | $189,500 | $43,000 | $146,500 |
| 2018 | $3,169 | $169,200 | $38,400 | $130,800 |
| 2017 | $3,066 | $169,200 | $38,400 | $130,800 |
| 2016 | $3,044 | $169,200 | $38,400 | $130,800 |
| 2015 | $3,039 | $169,200 | $38,400 | $130,800 |
| 2014 | $2,851 | $164,500 | $38,400 | $126,100 |
| 2013 | $2,739 | $164,500 | $38,400 | $126,100 |
Source: Public Records
Map
Nearby Homes