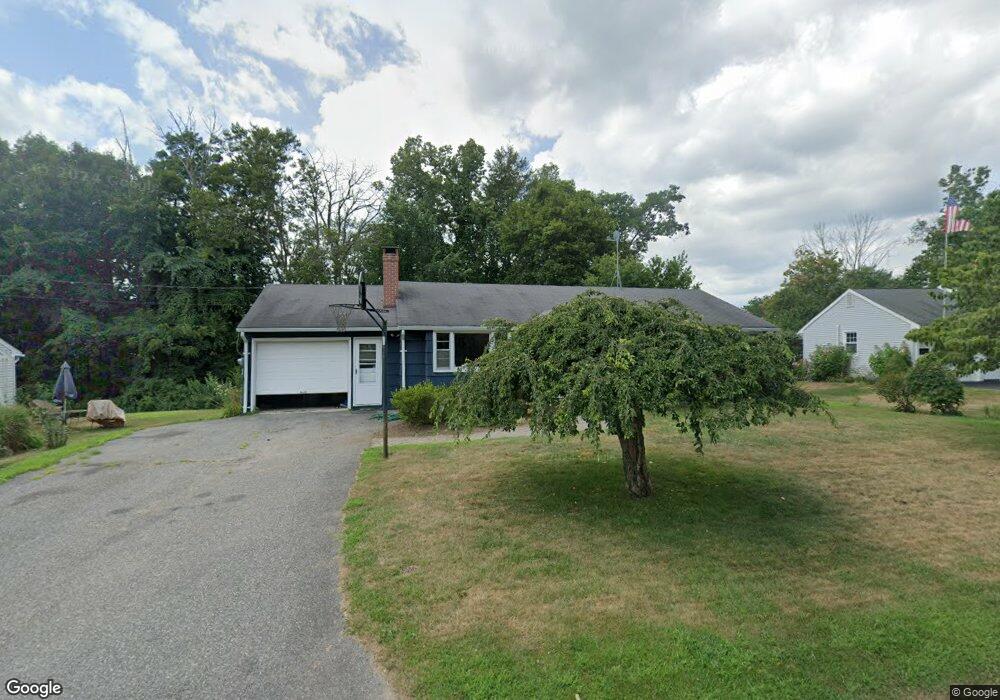
65 Maloney Ct Winsted, CT 06098
Estimated Value: $250,212 - $305,000
3
Beds
1
Bath
1,127
Sq Ft
$244/Sq Ft
Est. Value
About This Home
This home is located at 65 Maloney Ct, Winsted, CT 06098 and is currently estimated at $275,053, approximately $244 per square foot. 65 Maloney Ct is a home located in Litchfield County with nearby schools including Pearson School and St Anthony School.
Ownership History
Date
Name
Owned For
Owner Type
Purchase Details
Closed on
May 25, 2022
Sold by
Lucian Alfred and Lucian David
Bought by
Lucian William D
Current Estimated Value
Home Financials for this Owner
Home Financials are based on the most recent Mortgage that was taken out on this home.
Original Mortgage
$140,000
Outstanding Balance
$132,227
Interest Rate
5.25%
Mortgage Type
Purchase Money Mortgage
Estimated Equity
$142,826
Purchase Details
Closed on
Jan 28, 2008
Sold by
Perez Christine
Bought by
Lucian Ruth V
Home Financials for this Owner
Home Financials are based on the most recent Mortgage that was taken out on this home.
Original Mortgage
$180,000
Interest Rate
6.17%
Mortgage Type
Purchase Money Mortgage
Purchase Details
Closed on
Nov 20, 2002
Sold by
Vaccari Michael F and Vaccari Kimberly A
Bought by
Perez Christine and Perez Baltazar
Purchase Details
Closed on
Apr 30, 1991
Sold by
Centrella Mary J
Bought by
Vaccari Michael F and Vaccari Kimberly A
Create a Home Valuation Report for This Property
The Home Valuation Report is an in-depth analysis detailing your home's value as well as a comparison with similar homes in the area
Home Values in the Area
Average Home Value in this Area
Purchase History
| Date | Buyer | Sale Price | Title Company |
|---|---|---|---|
| Lucian William D | $175,000 | None Available | |
| Lucian William D | $175,000 | None Available | |
| Lucian Alfred | -- | None Available | |
| Lucian Alfred | -- | None Available | |
| Lucian William D | $175,000 | None Available | |
| Lucian Alfred | -- | None Available | |
| Lucian Ruth V | $190,000 | -- | |
| Lucian Ruth V | $190,000 | -- | |
| Perez Christine | $138,000 | -- | |
| Perez Christine | $138,000 | -- | |
| Vaccari Michael F | $105,000 | -- |
Source: Public Records
Mortgage History
| Date | Status | Borrower | Loan Amount |
|---|---|---|---|
| Open | Lucian William D | $140,000 | |
| Closed | Lucian William D | $140,000 | |
| Previous Owner | Vaccari Michael F | $217,500 | |
| Previous Owner | Vaccari Michael F | $180,000 |
Source: Public Records
Tax History
| Year | Tax Paid | Tax Assessment Tax Assessment Total Assessment is a certain percentage of the fair market value that is determined by local assessors to be the total taxable value of land and additions on the property. | Land | Improvement |
|---|---|---|---|---|
| 2025 | $3,596 | $123,270 | $33,180 | $90,090 |
| 2024 | $3,358 | $123,270 | $33,180 | $90,090 |
| 2023 | $3,253 | $123,270 | $33,180 | $90,090 |
| 2022 | $3,252 | $96,950 | $24,150 | $72,800 |
| 2021 | $3,252 | $96,950 | $24,150 | $72,800 |
| 2020 | $3,252 | $96,950 | $24,150 | $72,800 |
| 2019 | $3,252 | $96,950 | $24,150 | $72,800 |
| 2018 | $3,252 | $96,950 | $24,150 | $72,800 |
| 2017 | $3,160 | $94,220 | $24,150 | $70,070 |
| 2016 | $3,165 | $94,360 | $24,150 | $70,210 |
| 2015 | $3,086 | $94,360 | $24,150 | $70,210 |
| 2014 | $3,011 | $94,360 | $24,150 | $70,210 |
Source: Public Records
Map
Nearby Homes
Your Personal Tour Guide
Ask me questions while you tour the home.