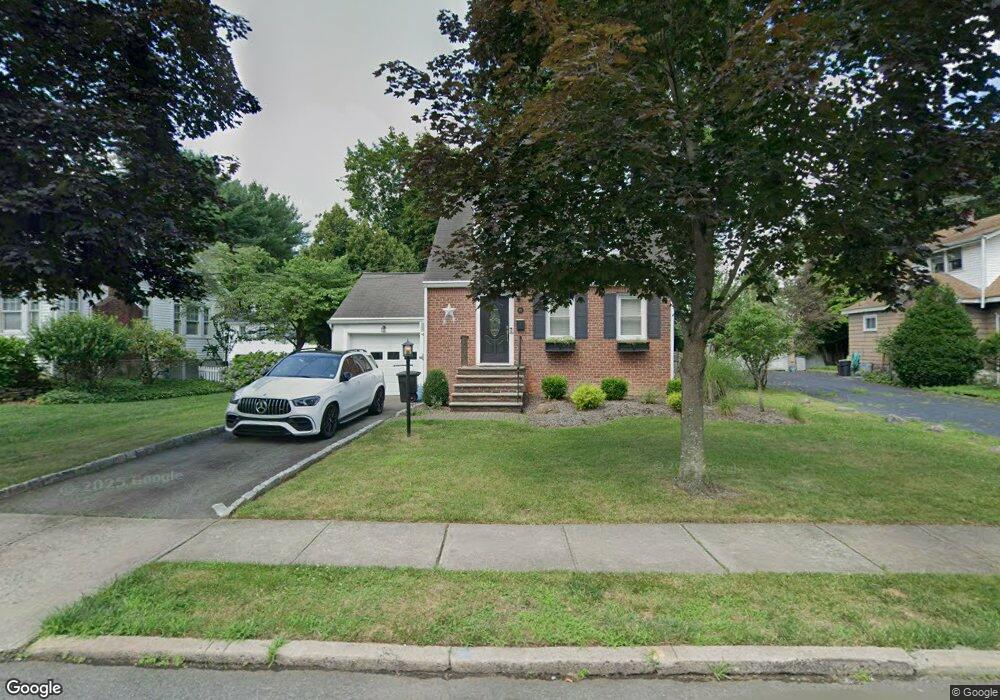
65 Maple St Ramsey, NJ 07446
Estimated Value: $623,000 - $679,747
2
Beds
1
Bath
1,176
Sq Ft
$562/Sq Ft
Est. Value
About This Home
This home is located at 65 Maple St, Ramsey, NJ 07446 and is currently estimated at $661,437, approximately $562 per square foot. 65 Maple St is a home located in Bergen County with nearby schools including Ramsey High School and Young World Day School.
Ownership History
Date
Name
Owned For
Owner Type
Purchase Details
Closed on
Dec 22, 2014
Sold by
Davis Erin B and Davis Ryan B
Bought by
Davis Michael and Caridi Christine
Current Estimated Value
Purchase Details
Closed on
Dec 12, 2008
Sold by
Jensen Christopher and Jensen Torian
Bought by
Davis Erin B and Davis Ryan B
Purchase Details
Closed on
Feb 2, 2005
Sold by
Keller Stephen
Bought by
Jensen Christopher and Purdy Torian
Home Financials for this Owner
Home Financials are based on the most recent Mortgage that was taken out on this home.
Original Mortgage
$328,000
Interest Rate
5.77%
Purchase Details
Closed on
Feb 13, 1995
Sold by
Fogel David
Bought by
Keller Stephen and Keller Mary Jean
Home Financials for this Owner
Home Financials are based on the most recent Mortgage that was taken out on this home.
Original Mortgage
$112,000
Interest Rate
9.17%
Create a Home Valuation Report for This Property
The Home Valuation Report is an in-depth analysis detailing your home's value as well as a comparison with similar homes in the area
Home Values in the Area
Average Home Value in this Area
Purchase History
| Date | Buyer | Sale Price | Title Company |
|---|---|---|---|
| Davis Michael | $410,000 | Westcor Land Title | |
| Davis Erin B | $399,000 | -- | |
| Jensen Christopher | $410,000 | -- | |
| Keller Stephen | $212,000 | -- |
Source: Public Records
Mortgage History
| Date | Status | Borrower | Loan Amount |
|---|---|---|---|
| Previous Owner | Jensen Christopher | $328,000 | |
| Previous Owner | Keller Stephen | $112,000 |
Source: Public Records
Tax History Compared to Growth
Tax History
| Year | Tax Paid | Tax Assessment Tax Assessment Total Assessment is a certain percentage of the fair market value that is determined by local assessors to be the total taxable value of land and additions on the property. | Land | Improvement |
|---|---|---|---|---|
| 2025 | $12,394 | $583,000 | $346,800 | $236,200 |
| 2024 | $12,021 | $439,200 | $289,500 | $149,700 |
| 2023 | $11,145 | $439,200 | $289,500 | $149,700 |
| 2022 | $11,145 | $424,900 | $289,500 | $135,400 |
| 2021 | $11,018 | $424,900 | $289,500 | $135,400 |
| 2020 | $10,920 | $424,900 | $289,500 | $135,400 |
| 2019 | $10,444 | $424,900 | $289,500 | $135,400 |
| 2018 | $10,185 | $424,900 | $289,500 | $135,400 |
| 2017 | $9,994 | $424,900 | $289,500 | $135,400 |
| 2016 | $9,717 | $424,900 | $289,500 | $135,400 |
| 2015 | $8,384 | $310,400 | $234,500 | $75,900 |
| 2014 | $8,241 | $310,400 | $234,500 | $75,900 |
Source: Public Records
Map
Nearby Homes