
Seller's Agent in 2023
Eleanor Reilly
Coldwell Banker Realty - Needham
(617) 448-4785
12 in this area
34 Total Sales
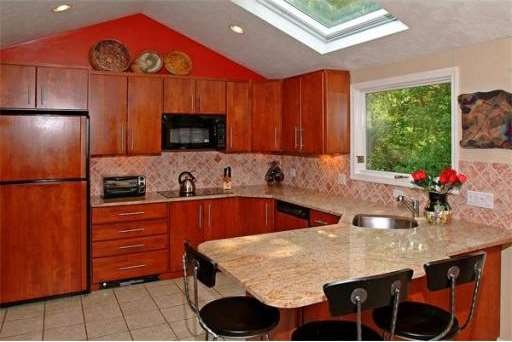
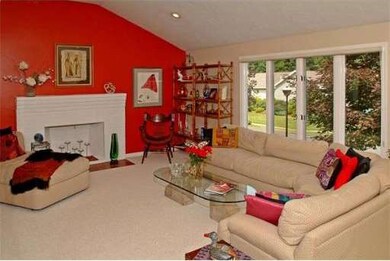


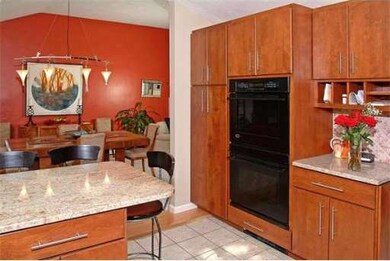

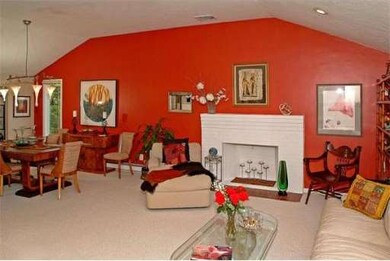
Boston Globe's "Home of the Week!" Brilliant oversized Contemporary*Great open floor plan for family entertainment*2 Familyrms*New gourmet granite kitchen,superior appliances*Cul-de-sac neighborhood near Babson/Olin Colleges*Master suite:new granite bath,soaking tub,separate shower & huge walk in closet*Skylights* Central Air*Large"tree house"Deck*Abuts Conservation*Professionally landscaped w/Sprinkler System*Walk to gym/pool/tennis/skating* 2miles to Needham/Wellesley Centers w/Train to Boston
| Date | Status | Loan Amount | Loan Type |
|---|---|---|---|
| Closed | $485,000 | Stand Alone Refi Refinance Of Original Loan | |
| Closed | $684,000 | Stand Alone Refi Refinance Of Original Loan | |
| Closed | $85,000 | Credit Line Revolving | |
| Closed | $417,000 | New Conventional | |
| Closed | $350,000 | No Value Available | |
| Closed | $465,750 | New Conventional | |
| Closed | $82,500 | No Value Available |
| Date | Event | Price | Change | Sq Ft Price |
|---|---|---|---|---|
| 07/15/2023 07/15/23 | Rented | $5,200 | 0.0% | -- |
| 06/13/2023 06/13/23 | Under Contract | -- | -- | -- |
| 05/23/2023 05/23/23 | For Rent | $5,200 | +23.8% | -- |
| 12/21/2018 12/21/18 | Rented | $4,200 | 0.0% | -- |
| 12/17/2018 12/17/18 | Under Contract | -- | -- | -- |
| 11/12/2018 11/12/18 | Price Changed | $4,200 | -8.7% | $2 / Sq Ft |
| 10/14/2018 10/14/18 | For Rent | $4,600 | 0.0% | -- |
| 05/29/2015 05/29/15 | Sold | $855,000 | 0.0% | $389 / Sq Ft |
| 05/08/2015 05/08/15 | Pending | -- | -- | -- |
| 04/15/2015 04/15/15 | Off Market | $855,000 | -- | -- |
| 04/08/2015 04/08/15 | For Sale | $849,000 | +31.6% | $386 / Sq Ft |
| 06/29/2012 06/29/12 | Sold | $645,000 | -2.9% | $258 / Sq Ft |
| 06/18/2012 06/18/12 | Pending | -- | -- | -- |
| 04/13/2012 04/13/12 | Price Changed | $664,000 | -0.7% | $266 / Sq Ft |
| 03/01/2012 03/01/12 | For Sale | $669,000 | -- | $268 / Sq Ft |
| Year | Tax Paid | Tax Assessment Tax Assessment Total Assessment is a certain percentage of the fair market value that is determined by local assessors to be the total taxable value of land and additions on the property. | Land | Improvement |
|---|---|---|---|---|
| 2025 | $12,575 | $1,186,300 | $680,300 | $506,000 |
| 2024 | $11,540 | $921,700 | $490,800 | $430,900 |
| 2023 | $11,647 | $893,200 | $490,800 | $402,400 |
| 2022 | $11,070 | $828,000 | $438,500 | $389,500 |
| 2021 | $10,789 | $828,000 | $438,500 | $389,500 |
| 2020 | $10,769 | $862,200 | $438,500 | $423,700 |
| 2019 | $10,142 | $818,600 | $398,900 | $419,700 |
| 2018 | $9,725 | $818,600 | $398,900 | $419,700 |
| 2017 | $9,096 | $765,000 | $398,900 | $366,100 |
| 2016 | $8,099 | $701,800 | $398,900 | $302,900 |
| 2015 | $7,923 | $701,800 | $398,900 | $302,900 |
| 2014 | $7,505 | $644,800 | $347,200 | $297,600 |
Seller's Agent in 2023
Eleanor Reilly
Coldwell Banker Realty - Needham
(617) 448-4785
12 in this area
34 Total Sales
Buyer's Agent in 2023
Eda Mayer
Coldwell Banker Realty - Newton
(617) 901-1535
3 in this area
34 Total Sales
Buyer's Agent in 2018
Michael Cohen
Keller Williams Realty
(617) 233-5810
19 in this area
44 Total Sales
Seller's Agent in 2015
Erik Pearson
Berkshire Hathaway HomeServices Town and Country Real Estate
(617) 910-8969
18 Total Sales
Buyer's Agent in 2015
Sonia Mirkin
Perfect Home Realty, LLC
(339) 234-0325
33 Total Sales
Seller's Agent in 2012
Susanne McInerney
eXp Realty
(617) 413-4550
3 in this area
37 Total Sales
Source: MLS Property Information Network (MLS PIN)
MLS Number: 71345504
APN: NEED-000145-000001
Disclaimer: Certain information contained herein is derived from information provided by parties other than Homes.com. All information provided is deemed reliable, but is not guaranteed to be accurate and should be independently verified.
![]() The property listing data and information, or the Images, set forth herein were provided to MLS Property Information Network, Inc. from third party sources, including sellers, lessors and public records, and were compiled by MLS Property Information Network, Inc. The property listing data and information, and the Images, are for the personal, non-commercial use of consumers having a good faith interest in purchasing or leasing listed properties of the type displayed to them and may not be used for any purpose other than to identify prospective properties which such consumers may have a good faith interest in purchasing or leasing. MLS Property Information Network, Inc. and its subscribers disclaim any and all representations and warranties as to the accuracy of the property listing data and information, or as to the accuracy of any of the Images, set forth herein.
The property listing data and information, or the Images, set forth herein were provided to MLS Property Information Network, Inc. from third party sources, including sellers, lessors and public records, and were compiled by MLS Property Information Network, Inc. The property listing data and information, and the Images, are for the personal, non-commercial use of consumers having a good faith interest in purchasing or leasing listed properties of the type displayed to them and may not be used for any purpose other than to identify prospective properties which such consumers may have a good faith interest in purchasing or leasing. MLS Property Information Network, Inc. and its subscribers disclaim any and all representations and warranties as to the accuracy of the property listing data and information, or as to the accuracy of any of the Images, set forth herein.