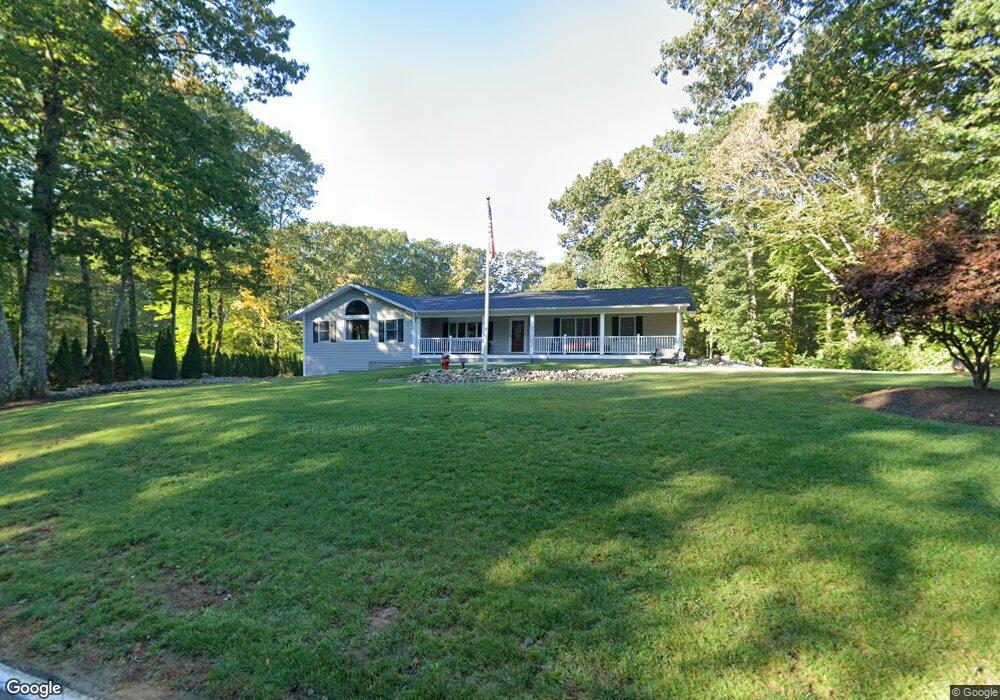
65 Morris Rd Prospect, CT 06712
Estimated Value: $414,000 - $559,000
5
Beds
3
Baths
2,448
Sq Ft
$209/Sq Ft
Est. Value
About This Home
This home is located at 65 Morris Rd, Prospect, CT 06712 and is currently estimated at $512,098, approximately $209 per square foot. 65 Morris Rd is a home located in New Haven County with nearby schools including Prospect Elementary School, Long River Middle School, and Woodland Regional High School.
Ownership History
Date
Name
Owned For
Owner Type
Purchase Details
Closed on
Sep 30, 1996
Sold by
Dickson James D and Carta Julie
Bought by
Geary John M
Current Estimated Value
Purchase Details
Closed on
Nov 29, 1995
Sold by
Long Cephas A
Bought by
Dickson James D and Carta Julie
Create a Home Valuation Report for This Property
The Home Valuation Report is an in-depth analysis detailing your home's value as well as a comparison with similar homes in the area
Home Values in the Area
Average Home Value in this Area
Purchase History
| Date | Buyer | Sale Price | Title Company |
|---|---|---|---|
| Geary John M | $145,000 | -- | |
| Dickson James D | $150,000 | -- |
Source: Public Records
Mortgage History
| Date | Status | Borrower | Loan Amount |
|---|---|---|---|
| Open | Dickson James D | $150,000 | |
| Closed | Dickson James D | $50,000 | |
| Closed | Dickson James D | $130,000 | |
| Closed | Dickson James D | $148,500 |
Source: Public Records
Tax History
| Year | Tax Paid | Tax Assessment Tax Assessment Total Assessment is a certain percentage of the fair market value that is determined by local assessors to be the total taxable value of land and additions on the property. | Land | Improvement |
|---|---|---|---|---|
| 2025 | $8,796 | $343,980 | $81,760 | $262,220 |
| 2024 | $7,540 | $234,610 | $81,740 | $152,870 |
| 2023 | $7,489 | $234,610 | $81,740 | $152,870 |
| 2022 | $7,496 | $234,610 | $81,740 | $152,870 |
| 2021 | $7,578 | $234,610 | $81,740 | $152,870 |
| 2020 | $7,251 | $229,460 | $81,730 | $147,730 |
| 2019 | $6,900 | $222,950 | $81,730 | $141,220 |
| 2018 | $6,738 | $217,360 | $81,730 | $135,630 |
| 2017 | $6,793 | $217,360 | $81,730 | $135,630 |
| 2016 | $6,501 | $217,360 | $81,730 | $135,630 |
| 2015 | $6,456 | $220,860 | $81,740 | $139,120 |
| 2014 | $6,401 | $220,860 | $81,740 | $139,120 |
Source: Public Records
Map
Nearby Homes
- 24 Rozum Cir
- 6 Laura Ave
- 66 Union City Rd
- 18 Olivia Ln
- 43 Bateswood Rd
- 20 Hydelor Ave
- 9 Cheryl Ln
- 46 Bracewood Rd
- 147 Sprucedale Dr
- 125 Salem Rd
- 6 Holley Ln
- 89 Rockledge Dr
- 44 Shadybrook Ln
- 17 White Oak Dr Unit 17
- 35 Monahan Ln
- 50 Lilac Ln Unit 50
- 12 Woodedge Ave
- 22 Crestwood Dr
- 171 Union City Rd
- 425 Scott Rd
Your Personal Tour Guide
Ask me questions while you tour the home.