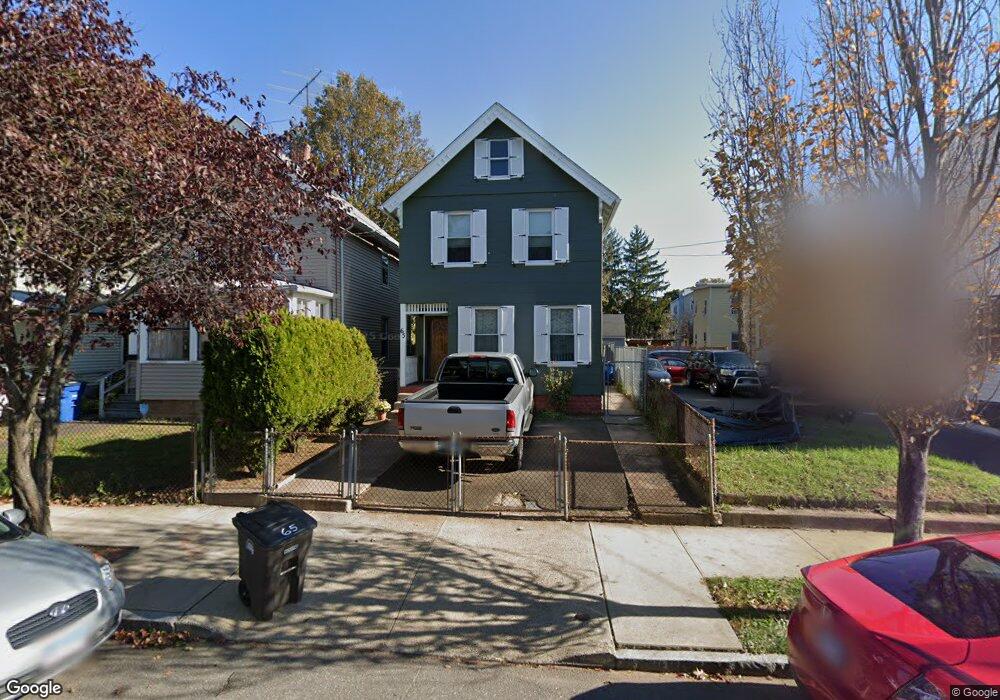
65 Morris St New Haven, CT 06519
The Hill NeighborhoodEstimated Value: $231,900 - $310,000
3
Beds
2
Baths
958
Sq Ft
$270/Sq Ft
Est. Value
About This Home
This home is located at 65 Morris St, New Haven, CT 06519 and is currently estimated at $258,725, approximately $270 per square foot. 65 Morris St is a home located in New Haven County with nearby schools including St Martin De Porres Academy.
Ownership History
Date
Name
Owned For
Owner Type
Purchase Details
Closed on
Sep 25, 1991
Sold by
Williams Scott R and Williams Donna M
Bought by
Kotora Janice M
Current Estimated Value
Home Financials for this Owner
Home Financials are based on the most recent Mortgage that was taken out on this home.
Original Mortgage
$111,200
Interest Rate
9.1%
Mortgage Type
Unknown
Purchase Details
Closed on
Feb 22, 1979
Bought by
Machedo Lorenzo and Machedo Esperanca
Create a Home Valuation Report for This Property
The Home Valuation Report is an in-depth analysis detailing your home's value as well as a comparison with similar homes in the area
Home Values in the Area
Average Home Value in this Area
Purchase History
| Date | Buyer | Sale Price | Title Company |
|---|---|---|---|
| Kotora Janice M | $139,000 | -- | |
| Machedo Lorenzo | -- | -- |
Source: Public Records
Mortgage History
| Date | Status | Borrower | Loan Amount |
|---|---|---|---|
| Closed | Machedo Lorenzo | $111,200 |
Source: Public Records
Tax History Compared to Growth
Tax History
| Year | Tax Paid | Tax Assessment Tax Assessment Total Assessment is a certain percentage of the fair market value that is determined by local assessors to be the total taxable value of land and additions on the property. | Land | Improvement |
|---|---|---|---|---|
| 2025 | $3,489 | $88,550 | $20,510 | $68,040 |
| 2024 | $3,409 | $88,550 | $20,510 | $68,040 |
| 2023 | $3,294 | $88,550 | $20,510 | $68,040 |
| 2022 | $3,520 | $88,550 | $20,510 | $68,040 |
| 2021 | $2,534 | $57,750 | $17,640 | $40,110 |
| 2020 | $2,534 | $57,750 | $17,640 | $40,110 |
| 2019 | $2,482 | $57,750 | $17,640 | $40,110 |
| 2018 | $2,482 | $57,750 | $17,640 | $40,110 |
| 2017 | $2,234 | $57,750 | $17,640 | $40,110 |
| 2016 | $2,074 | $49,910 | $10,710 | $39,200 |
| 2015 | $2,074 | $49,910 | $10,710 | $39,200 |
| 2014 | $2,074 | $49,910 | $10,710 | $39,200 |
Source: Public Records
Map
Nearby Homes