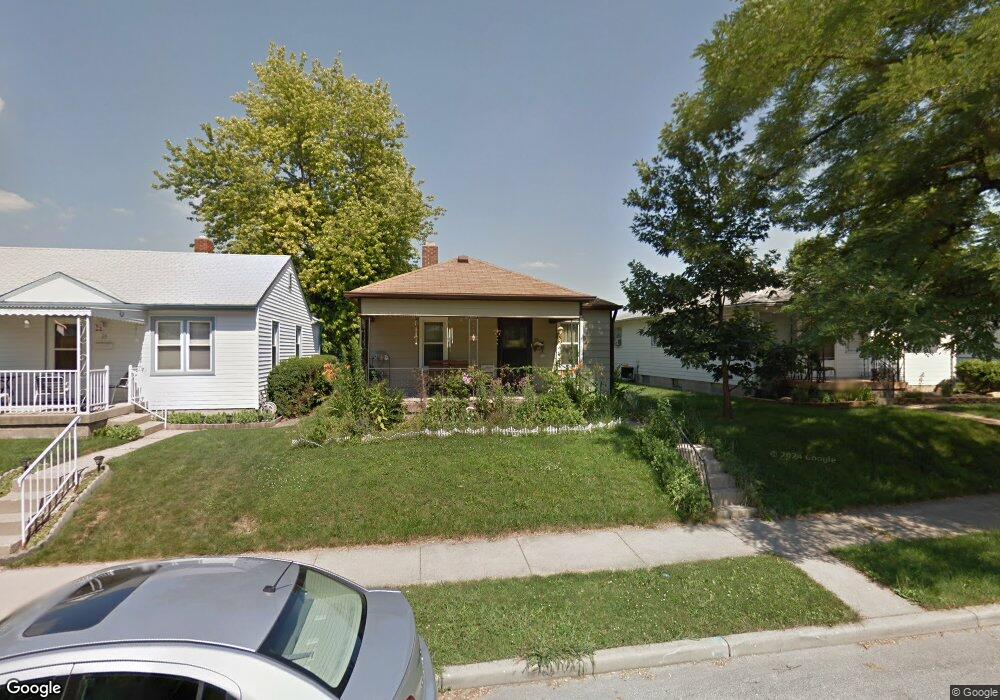
65 N 4th Ave Beech Grove, IN 46107
Estimated Value: $149,000 - $189,000
2
Beds
1
Bath
756
Sq Ft
$222/Sq Ft
Est. Value
About This Home
This home is located at 65 N 4th Ave, Beech Grove, IN 46107 and is currently estimated at $167,818, approximately $221 per square foot. 65 N 4th Ave is a home located in Marion County with nearby schools including Hornet Park Elementary School, Central Elementary School, and South Grove Intermediate School.
Ownership History
Date
Name
Owned For
Owner Type
Purchase Details
Closed on
Oct 26, 2018
Sold by
Dicus Peggy A
Bought by
Kopp Mackenzie L
Current Estimated Value
Home Financials for this Owner
Home Financials are based on the most recent Mortgage that was taken out on this home.
Original Mortgage
$55,967
Outstanding Balance
$49,282
Interest Rate
4.87%
Mortgage Type
FHA
Estimated Equity
$118,537
Purchase Details
Closed on
Dec 11, 2007
Sold by
Dream Home Realty Inc
Bought by
Kopp Peggy A
Home Financials for this Owner
Home Financials are based on the most recent Mortgage that was taken out on this home.
Original Mortgage
$77,634
Interest Rate
6.31%
Mortgage Type
VA
Purchase Details
Closed on
Jun 19, 2007
Sold by
Household Financie Corp Iii
Bought by
Dream Home Realty Inc
Purchase Details
Closed on
Jul 7, 2006
Sold by
Briley Patricia and Estate Of Margaret Priest
Bought by
Household Finance Corp Iii
Create a Home Valuation Report for This Property
The Home Valuation Report is an in-depth analysis detailing your home's value as well as a comparison with similar homes in the area
Home Values in the Area
Average Home Value in this Area
Purchase History
| Date | Buyer | Sale Price | Title Company |
|---|---|---|---|
| Kopp Mackenzie L | $57,000 | Chicago Title | |
| Kopp Peggy A | -- | Chicago Title Insurance Co | |
| Dream Home Realty Inc | -- | None Available | |
| Household Finance Corp Iii | -- | None Available |
Source: Public Records
Mortgage History
| Date | Status | Borrower | Loan Amount |
|---|---|---|---|
| Open | Kopp Mackenzie L | $55,967 | |
| Previous Owner | Kopp Peggy A | $77,634 |
Source: Public Records
Tax History Compared to Growth
Tax History
| Year | Tax Paid | Tax Assessment Tax Assessment Total Assessment is a certain percentage of the fair market value that is determined by local assessors to be the total taxable value of land and additions on the property. | Land | Improvement |
|---|---|---|---|---|
| 2024 | $1,586 | $122,900 | $17,000 | $105,900 |
| 2023 | $1,586 | $122,900 | $17,000 | $105,900 |
| 2022 | $1,445 | $110,300 | $17,000 | $93,300 |
| 2021 | $1,184 | $95,300 | $17,000 | $78,300 |
| 2020 | $1,067 | $90,500 | $17,000 | $73,500 |
| 2019 | $964 | $84,600 | $14,000 | $70,600 |
| 2018 | $739 | $67,500 | $14,000 | $53,500 |
| 2017 | $1,707 | $68,200 | $14,000 | $54,200 |
| 2016 | $1,433 | $57,800 | $14,000 | $43,800 |
| 2014 | $1,390 | $59,100 | $14,000 | $45,100 |
| 2013 | $66 | $59,100 | $14,000 | $45,100 |
Source: Public Records
Map
Nearby Homes