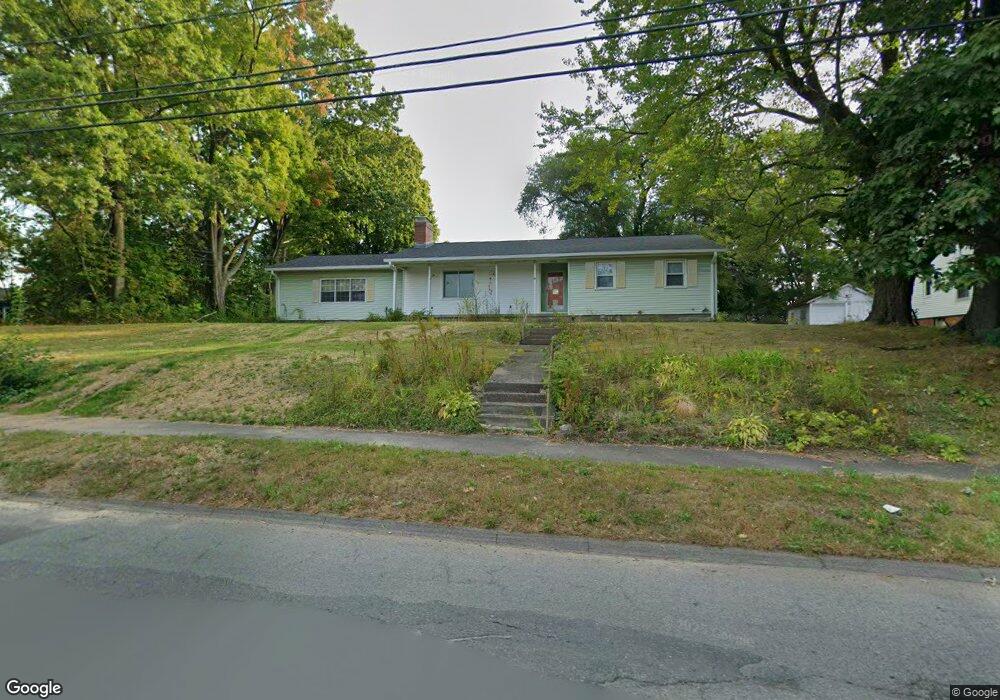
65 N Main St South Hadley, MA 01075
Estimated Value: $356,000 - $404,946
3
Beds
3
Baths
1,364
Sq Ft
$281/Sq Ft
Est. Value
About This Home
This home is located at 65 N Main St, South Hadley, MA 01075 and is currently estimated at $382,737, approximately $280 per square foot. 65 N Main St is a home located in Hampshire County with nearby schools including Plains Elementary School, Mosier Elementary School, and Michael E. Smith Middle School.
Ownership History
Date
Name
Owned For
Owner Type
Purchase Details
Closed on
Sep 1, 2011
Sold by
Rainaud Cynthia
Bought by
Nickerson Joseph W
Current Estimated Value
Home Financials for this Owner
Home Financials are based on the most recent Mortgage that was taken out on this home.
Original Mortgage
$180,212
Outstanding Balance
$124,930
Interest Rate
4.52%
Mortgage Type
Purchase Money Mortgage
Estimated Equity
$257,807
Purchase Details
Closed on
Aug 18, 2009
Sold by
Rainaud William E and Rainaud Cynthia Ann
Bought by
Rainaud Cynthia Ann
Purchase Details
Closed on
Jun 28, 1996
Sold by
Morton Grace E and Morton John E
Bought by
Rainaud Cynthia and Rainaud William E
Home Financials for this Owner
Home Financials are based on the most recent Mortgage that was taken out on this home.
Original Mortgage
$80,000
Interest Rate
8.05%
Mortgage Type
Purchase Money Mortgage
Create a Home Valuation Report for This Property
The Home Valuation Report is an in-depth analysis detailing your home's value as well as a comparison with similar homes in the area
Home Values in the Area
Average Home Value in this Area
Purchase History
| Date | Buyer | Sale Price | Title Company |
|---|---|---|---|
| Nickerson Joseph W | $184,900 | -- | |
| Rainaud Cynthia Ann | -- | -- | |
| Rainaud Cynthia | $110,000 | -- |
Source: Public Records
Mortgage History
| Date | Status | Borrower | Loan Amount |
|---|---|---|---|
| Open | Nickerson Joseph W | $180,212 | |
| Previous Owner | Rainaud Cynthia | $25,000 | |
| Previous Owner | Rainaud Cynthia | $85,000 | |
| Previous Owner | Rainaud Cynthia | $80,000 |
Source: Public Records
Tax History Compared to Growth
Tax History
| Year | Tax Paid | Tax Assessment Tax Assessment Total Assessment is a certain percentage of the fair market value that is determined by local assessors to be the total taxable value of land and additions on the property. | Land | Improvement |
|---|---|---|---|---|
| 2025 | $5,208 | $326,900 | $95,000 | $231,900 |
| 2024 | $5,218 | $313,400 | $88,900 | $224,500 |
| 2023 | $4,774 | $272,000 | $80,600 | $191,400 |
| 2022 | $4,533 | $245,300 | $80,600 | $164,700 |
| 2021 | $4,470 | $229,700 | $75,400 | $154,300 |
| 2020 | $4,373 | $219,300 | $75,400 | $143,900 |
| 2019 | $4,141 | $205,500 | $71,800 | $133,700 |
| 2018 | $3,986 | $200,000 | $69,700 | $130,300 |
| 2017 | $3,839 | $190,800 | $69,700 | $121,100 |
| 2016 | $3,770 | $189,900 | $69,700 | $120,200 |
| 2015 | $3,572 | $184,300 | $67,400 | $116,900 |
Source: Public Records
Map
Nearby Homes
- 49 N Main St
- 27 Bardwell St Unit 4
- 41 W Summit St Unit 72
- 41 W Summit St Unit 54
- 41 W Summit St Unit 32
- 41 W Summit St Unit 55
- 70 Lathrop St
- 2 Arbor Way Unit C
- 32 North St
- 84 Judd Ave
- 75 Elm St
- 87 Pine St
- 47 Pynchon Rd
- 48 N Canal St
- 7 Hunter Terrace
- 20 Linden St
- 3 Ralph Ave
- 12 School St
- 17 Cleveland St
- 146 Beech St