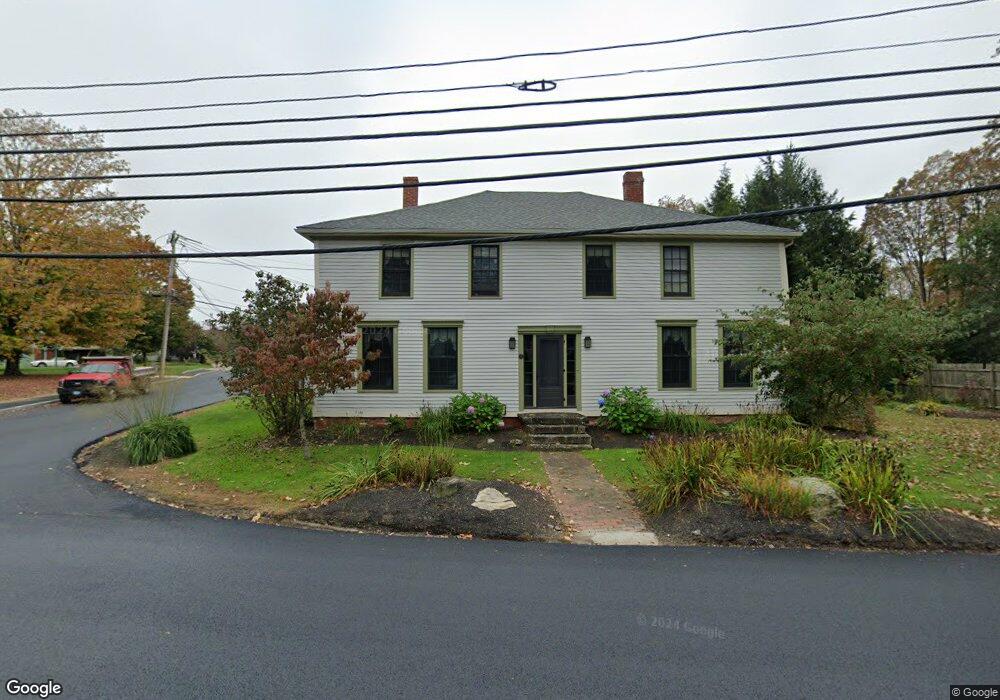
65 N Main St West Brookfield, MA 01585
Estimated Value: $482,523 - $556,000
4
Beds
3
Baths
2,880
Sq Ft
$181/Sq Ft
Est. Value
About This Home
This home is located at 65 N Main St, West Brookfield, MA 01585 and is currently estimated at $520,131, approximately $180 per square foot. 65 N Main St is a home located in Worcester County with nearby schools including Quaboag Regional High School.
Ownership History
Date
Name
Owned For
Owner Type
Purchase Details
Closed on
Oct 7, 1994
Sold by
Dmuchovsky Daniel and Dmuchovsky Christine
Bought by
Leasca George P and Leasca Martha
Current Estimated Value
Create a Home Valuation Report for This Property
The Home Valuation Report is an in-depth analysis detailing your home's value as well as a comparison with similar homes in the area
Home Values in the Area
Average Home Value in this Area
Purchase History
We collect this data history from publicly available records. To have your information removed, we recommend requesting removal directly through your county’s website.
| Date | Buyer | Sale Price | Title Company |
|---|---|---|---|
| Leasca George P | $140,000 | -- |
Source: Public Records
Mortgage History
We collect this data history from publicly available records. To have your information removed, we recommend requesting removal directly through your county’s website.
| Date | Status | Borrower | Loan Amount |
|---|---|---|---|
| Open | Leasca George P | $99,771 | |
| Closed | Leasca George P | $122,100 | |
| Closed | Leasca George P | $100,000 |
Source: Public Records
Tax History
| Year | Tax Paid | Tax Assessment Tax Assessment Total Assessment is a certain percentage of the fair market value that is determined by local assessors to be the total taxable value of land and additions on the property. | Land | Improvement |
|---|---|---|---|---|
| 2025 | $4,930 | $457,300 | $52,100 | $405,200 |
| 2024 | $5,135 | $457,300 | $52,100 | $405,200 |
| 2023 | $5,006 | $417,500 | $47,400 | $370,100 |
| 2022 | $4,689 | $354,400 | $45,100 | $309,300 |
| 2021 | $4,544 | $323,900 | $45,100 | $278,800 |
| 2020 | $3,901 | $265,400 | $45,100 | $220,300 |
| 2019 | $4,159 | $265,400 | $45,100 | $220,300 |
| 2018 | $4,114 | $256,000 | $45,100 | $210,900 |
| 2017 | $4,169 | $259,600 | $46,200 | $213,400 |
| 2016 | $3,561 | $229,600 | $46,200 | $183,400 |
| 2015 | $3,439 | $229,600 | $46,200 | $183,400 |
Source: Public Records
Map
Nearby Homes
- 24 Maple St
- 4 E Main St
- 11 Central St
- 20 Central St
- 72 New Braintree Rd
- 12 West St
- 34 Roy Terrace
- 15 Birch Hill Rd
- 47 Ware St
- 17 Moorings Way
- 15 Oak Dr
- 97 Wickaboag Valley Rd
- 106 Wickaboag Valley Rd
- 21 Beach Dr
- 10 Foster Rd
- 4 Avalon Place
- 22 Birch St
- 291 Wigwam Rd
- 18-20 Old w Brookfield Rd
- 950 Old West Brookfield Rd
Your Personal Tour Guide
Ask me questions while you tour the home.