Estimated Value: $669,506 - $825,000
3
Beds
2
Baths
1,656
Sq Ft
$444/Sq Ft
Est. Value
About This Home
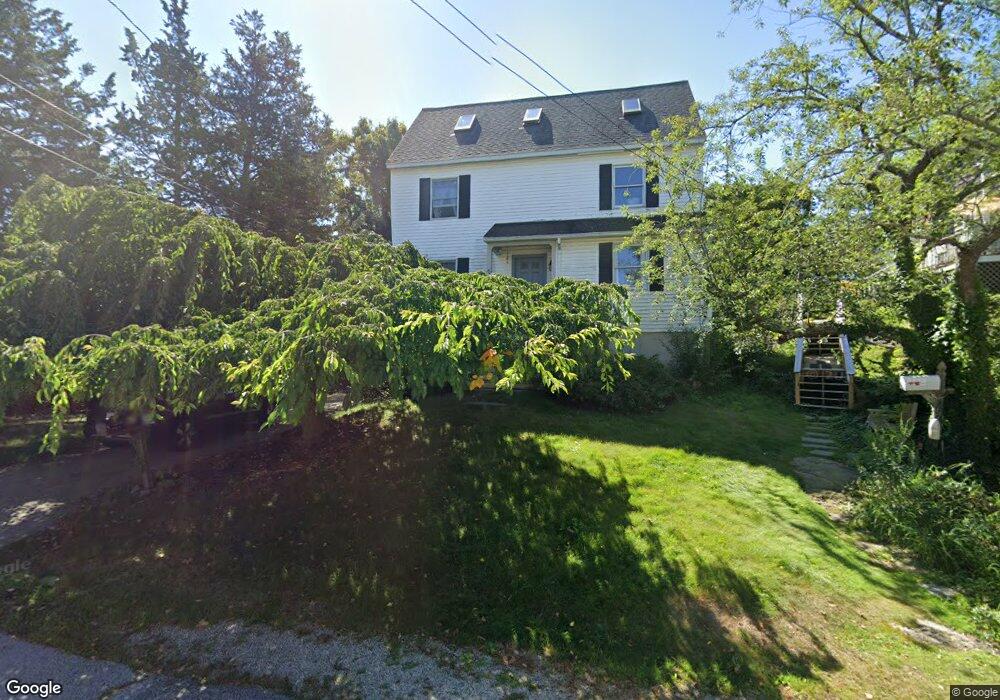
This home is located at 65 N Truro St, Hull, MA 02045 and is currently estimated at $734,877, approximately $443 per square foot. 65 N Truro St is a home located in Plymouth County with nearby schools including Lillian M. Jacobs Elementary School, Memorial Middle School, and Hull High School.
Ownership History
Date
Name
Owned For
Owner Type
Purchase Details
Closed on
Aug 5, 2004
Sold by
Silver Ft and Silver
Bought by
Pritchard Judith
Current Estimated Value
Purchase Details
Closed on
Aug 14, 2003
Sold by
Silver Ft and Silver
Bought by
Silver Melvin M and Pritchard Judith
Home Financials for this Owner
Home Financials are based on the most recent Mortgage that was taken out on this home.
Original Mortgage
$71,200
Interest Rate
5.46%
Mortgage Type
Purchase Money Mortgage
Create a Home Valuation Report for This Property
The Home Valuation Report is an in-depth analysis detailing your home's value as well as a comparison with similar homes in the area
Home Values in the Area
Average Home Value in this Area
Purchase History
| Date | Buyer | Sale Price | Title Company |
|---|---|---|---|
| Pritchard Judith | -- | -- | |
| Silver Melvin M | -- | -- |
Source: Public Records
Mortgage History
| Date | Status | Borrower | Loan Amount |
|---|---|---|---|
| Previous Owner | Silver Melvin M | $15,000 | |
| Previous Owner | Silver Melvin M | $71,200 | |
| Previous Owner | Silver Melvin M | $17,000 | |
| Previous Owner | Silver Melvin M | $75,000 |
Source: Public Records
Tax History Compared to Growth
Tax History
| Year | Tax Paid | Tax Assessment Tax Assessment Total Assessment is a certain percentage of the fair market value that is determined by local assessors to be the total taxable value of land and additions on the property. | Land | Improvement |
|---|---|---|---|---|
| 2025 | $6,440 | $575,000 | $248,100 | $326,900 |
| 2024 | $6,397 | $549,100 | $240,100 | $309,000 |
| 2023 | $6,058 | $497,800 | $224,100 | $273,700 |
| 2022 | $5,876 | $468,600 | $208,100 | $260,500 |
| 2021 | $6,129 | $441,600 | $184,100 | $257,500 |
| 2020 | $5,912 | $417,600 | $184,100 | $233,500 |
| 2019 | $5,249 | $402,200 | $176,100 | $226,100 |
| 2018 | $5,291 | $372,800 | $176,100 | $196,700 |
| 2017 | $5,112 | $358,100 | $176,100 | $182,000 |
| 2016 | $4,827 | $358,100 | $176,100 | $182,000 |
| 2015 | $4,648 | $333,400 | $148,100 | $185,300 |
| 2014 | $4,624 | $333,400 | $148,100 | $185,300 |
Source: Public Records
Map
Nearby Homes
- 61 Barnstable Rd
- 155 George Washington Blvd Unit 304
- 67 Hampton Cir
- 40 Rockaway Ave
- 14 Standish Rd
- 23 Wyola Rd
- 15 Park Ave Unit 307
- 134 Hampton Cir
- 15 Lincoln Ave
- 22 Berkley Rd Unit C
- 22 Berkley Rd Unit B
- 19 Berkley Rd
- 7 Bay Street (The Estuary) Unit 3
- 4 Atherton Rd
- 155 Nantasket Ave Unit B402
- 10 Sagamore Terrace
- 120 Nantasket Ave Unit 304
- 120 Nantasket Ave Unit PH5
- 120 Nantasket Ave Unit 201
- 40 Oceanside Dr Unit 40