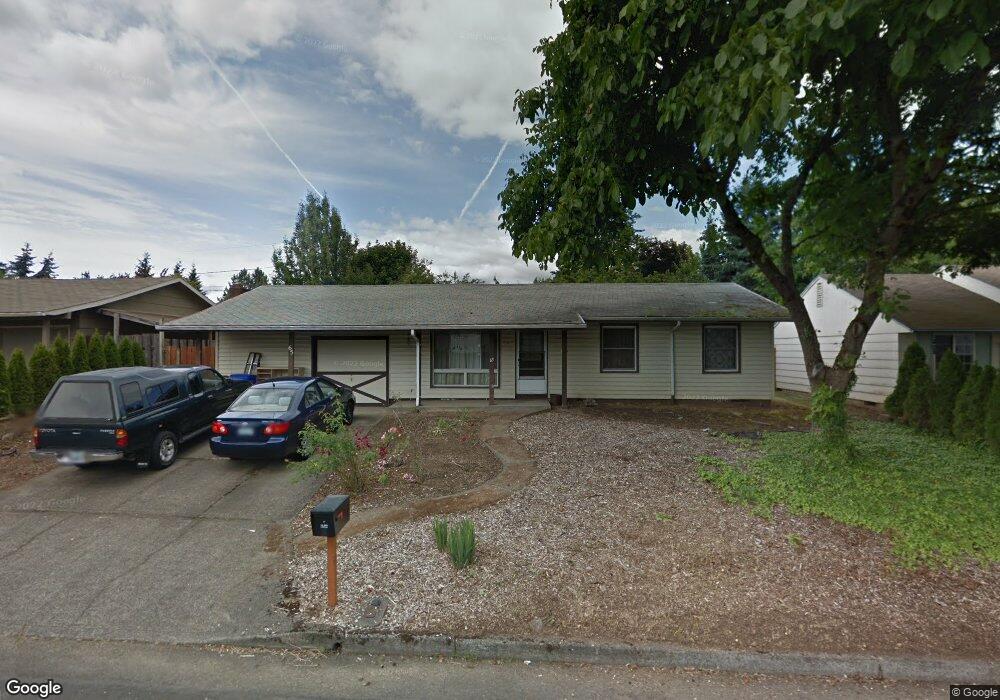
65 NE 23rd St Gresham, OR 97030
North Central NeighborhoodEstimated Value: $385,000 - $434,000
3
Beds
1
Bath
1,255
Sq Ft
$326/Sq Ft
Est. Value
About This Home
This home is located at 65 NE 23rd St, Gresham, OR 97030 and is currently estimated at $409,646, approximately $326 per square foot. 65 NE 23rd St is a home located in Multnomah County with nearby schools including Highland Elementary School, Clear Creek Middle School, and Gresham High School.
Ownership History
Date
Name
Owned For
Owner Type
Purchase Details
Closed on
Mar 6, 2020
Sold by
Lovelace Victor C
Bought by
Lovelace Victor C
Current Estimated Value
Home Financials for this Owner
Home Financials are based on the most recent Mortgage that was taken out on this home.
Original Mortgage
$169,922
Interest Rate
3.37%
Mortgage Type
FHA
Purchase Details
Closed on
Feb 17, 1999
Sold by
Lovelace Charles F
Bought by
Lovelace Charles F
Home Financials for this Owner
Home Financials are based on the most recent Mortgage that was taken out on this home.
Original Mortgage
$122,400
Interest Rate
6.78%
Mortgage Type
Purchase Money Mortgage
Purchase Details
Closed on
May 27, 1998
Sold by
Lovelace Charles F
Bought by
Lovelace Charles F and Lovelace Eleanor A
Create a Home Valuation Report for This Property
The Home Valuation Report is an in-depth analysis detailing your home's value as well as a comparison with similar homes in the area
Home Values in the Area
Average Home Value in this Area
Purchase History
| Date | Buyer | Sale Price | Title Company |
|---|---|---|---|
| Lovelace Victor C | -- | None Available | |
| Lovelace Victor C | -- | None Available | |
| Lovelace Charles F | -- | Fidelity National Title Co | |
| Lovelace Charles F | -- | -- |
Source: Public Records
Mortgage History
| Date | Status | Borrower | Loan Amount |
|---|---|---|---|
| Closed | Lovelace Victor C | $169,922 | |
| Closed | Lovelace Charles F | $122,400 |
Source: Public Records
Tax History
| Year | Tax Paid | Tax Assessment Tax Assessment Total Assessment is a certain percentage of the fair market value that is determined by local assessors to be the total taxable value of land and additions on the property. | Land | Improvement |
|---|---|---|---|---|
| 2025 | $4,220 | $207,380 | -- | -- |
| 2024 | $4,040 | $201,340 | -- | -- |
| 2023 | $3,680 | $195,480 | $0 | $0 |
| 2022 | $3,578 | $189,790 | $0 | $0 |
| 2021 | $3,488 | $184,270 | $0 | $0 |
| 2020 | $3,282 | $178,910 | $0 | $0 |
| 2019 | $3,196 | $173,700 | $0 | $0 |
| 2018 | $3,047 | $168,650 | $0 | $0 |
| 2017 | $2,923 | $163,740 | $0 | $0 |
| 2016 | $2,578 | $158,980 | $0 | $0 |
Source: Public Records
Map
Nearby Homes
- 1035 SE 225th Ave
- 450 NE 22nd St
- 2730 NE Roberts Ave
- 535 NE 24th St
- 349 NE 18th St
- 1783 1791 NE Beech Place
- 2775 NE Linden Ave
- 54 NW 13th St
- 21532 SE Alder St
- 920 SE 214th Ave
- 210 SE 218th Ave
- 1556 NE 27th Terrace
- 21525 SE Oak St
- 660 NE 9th St
- 894 NE Linden Ave
- 21400 SE Stark St Unit 2
- 21553 SE Ankeny Terrace
- 21260 SE Stark St
- 21033 SE Clay Ct
- 1830 NE Hogan Dr Unit 83
Your Personal Tour Guide
Ask me questions while you tour the home.