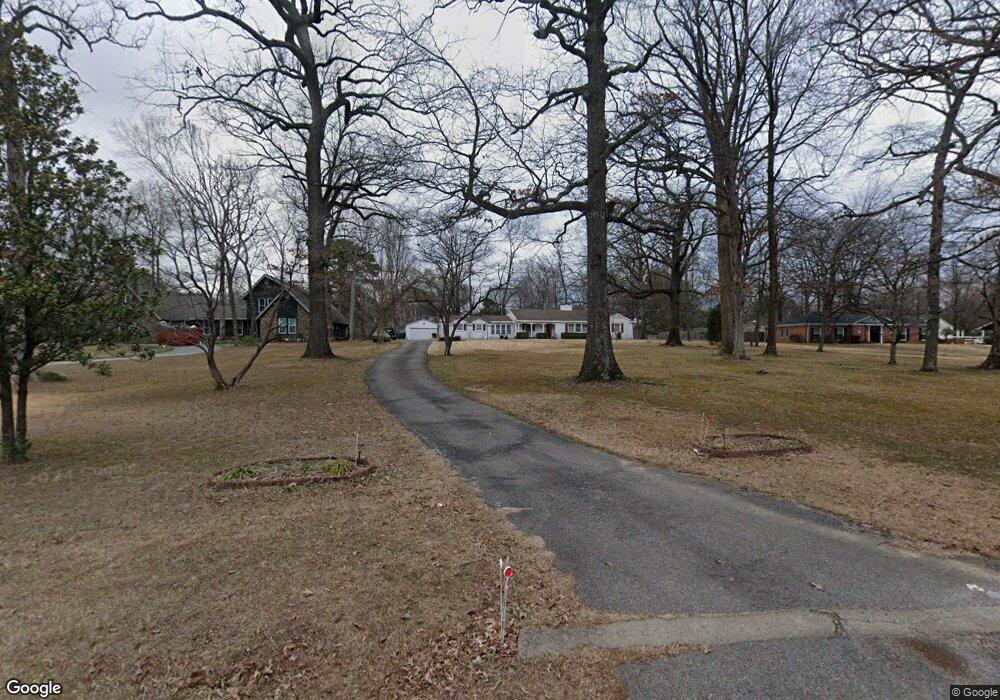
65 Old Humboldt Rd Jackson, TN 38305
Estimated Value: $271,000 - $321,000
--
Bed
2
Baths
2,395
Sq Ft
$124/Sq Ft
Est. Value
About This Home
This home is located at 65 Old Humboldt Rd, Jackson, TN 38305 and is currently estimated at $296,118, approximately $123 per square foot. 65 Old Humboldt Rd is a home located in Madison County with nearby schools including Thelma Barker Elementary School, Northeast Middle School, and North Side High School.
Ownership History
Date
Name
Owned For
Owner Type
Purchase Details
Closed on
Sep 26, 2008
Sold by
Parker Stanley N
Bought by
Sherrod Marvel B
Current Estimated Value
Purchase Details
Closed on
Apr 1, 2005
Sold by
Haywood Hines C
Bought by
Parker Stanley N
Home Financials for this Owner
Home Financials are based on the most recent Mortgage that was taken out on this home.
Original Mortgage
$145,000
Interest Rate
5.74%
Purchase Details
Closed on
Mar 26, 1999
Bought by
Hines C Haywood
Purchase Details
Closed on
May 28, 1993
Bought by
Blacknall John N
Purchase Details
Closed on
Jun 20, 1991
Bought by
Dunn Steve and Dunn Janie
Purchase Details
Closed on
Sep 16, 1988
Bought by
Thompson Henry Earl
Purchase Details
Closed on
Jul 25, 1984
Bought by
Willette William Lowry
Purchase Details
Closed on
Oct 2, 1951
Bought by
Moore Martha W
Create a Home Valuation Report for This Property
The Home Valuation Report is an in-depth analysis detailing your home's value as well as a comparison with similar homes in the area
Home Values in the Area
Average Home Value in this Area
Purchase History
| Date | Buyer | Sale Price | Title Company |
|---|---|---|---|
| Sherrod Marvel B | $178,500 | -- | |
| Parker Stanley N | $160,000 | -- | |
| Hines C Haywood | $143,000 | -- | |
| Blacknall John N | $117,000 | -- | |
| Dunn Steve | -- | -- | |
| Thompson Henry Earl | -- | -- | |
| Willette William Lowry | -- | -- | |
| Moore Martha W | -- | -- |
Source: Public Records
Mortgage History
| Date | Status | Borrower | Loan Amount |
|---|---|---|---|
| Previous Owner | Moore Martha W | $145,000 |
Source: Public Records
Tax History Compared to Growth
Tax History
| Year | Tax Paid | Tax Assessment Tax Assessment Total Assessment is a certain percentage of the fair market value that is determined by local assessors to be the total taxable value of land and additions on the property. | Land | Improvement |
|---|---|---|---|---|
| 2024 | $869 | $46,400 | $7,700 | $38,700 |
| 2022 | $1,617 | $46,400 | $7,700 | $38,700 |
| 2021 | $1,178 | $27,325 | $7,700 | $19,625 |
| 2020 | $1,178 | $27,325 | $7,700 | $19,625 |
| 2019 | $1,178 | $27,325 | $7,700 | $19,625 |
| 2018 | $1,169 | $27,125 | $7,700 | $19,425 |
| 2017 | $1,180 | $26,750 | $7,700 | $19,050 |
| 2016 | $1,100 | $26,750 | $7,700 | $19,050 |
| 2015 | $1,100 | $26,750 | $7,700 | $19,050 |
| 2014 | $1,067 | $25,950 | $7,700 | $18,250 |
Source: Public Records
Map
Nearby Homes
- 75 Old Humboldt Rd
- 7 Robinhood Ln
- 55 Brookstone Place
- 76 Moorewood Dr
- 45 Countrywood Dr
- 10 Richstone Cove
- 60 Marlow Dr
- 157 Commanche Trail
- 56 Braddock Place
- 27 Mill Creek Cove
- 63 Highland Ridge Cove
- 188 Quail Ridge
- 116 Chickering Rd
- 52 Commanche Trail
- 3 Pueblo Cove
- 263 Willowridge Cir
- 66 Navajo Cove
- 20 Branson Place
- 85 Charjean Dr
- 68 Charjean Dr
- 43 Old Humboldt Rd
- 38 Countrywood Cove
- 87 Old Humboldt Rd
- 42 Old Humboldt Rd
- 31 Melissa Cove
- 30 Countrywood Cove
- 45 Brookstone Place
- 91 Old Humboldt Rd
- 37 Old Humboldt Rd
- 23 Melissa Cove
- 22 Countrywood Cove
- 49 Brookstone Place
- 44 Countrywood Cove
- 15 Robinhood Ln
- 8 Robinhood Ln
- 37 Brookstone Place
- 29 Old Humboldt Rd
- 103 Old Humboldt Rd
- 32 Melissa Cove
- 17 Melissa Cove