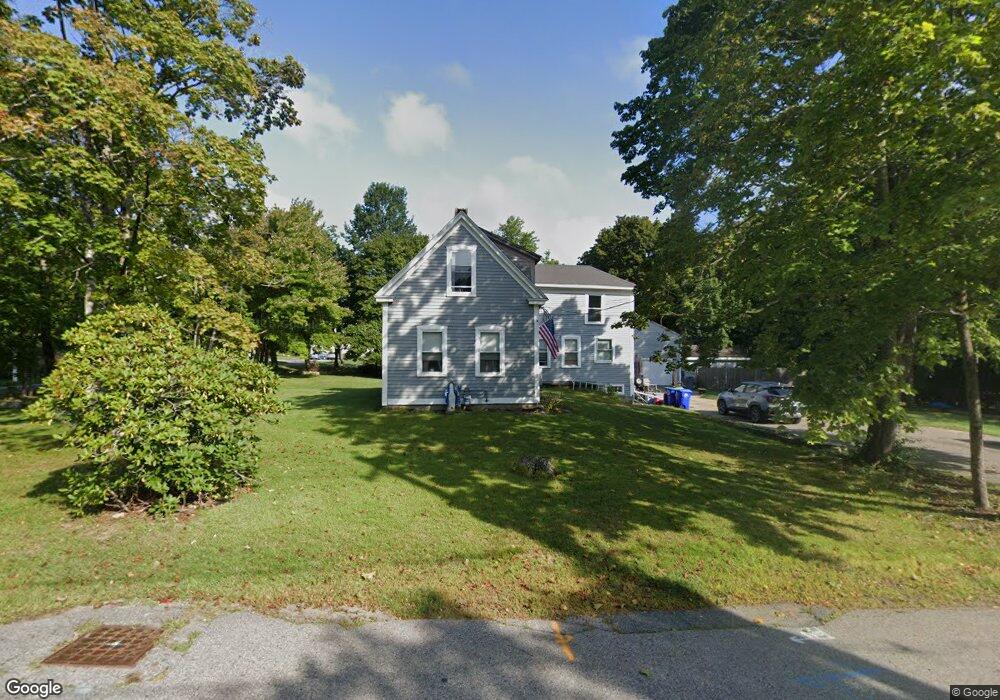
65 Oregon Ave Rockland, MA 02370
Estimated Value: $552,000 - $594,336
4
Beds
2
Baths
1,668
Sq Ft
$344/Sq Ft
Est. Value
About This Home
This home is located at 65 Oregon Ave, Rockland, MA 02370 and is currently estimated at $574,334, approximately $344 per square foot. 65 Oregon Ave is a home located in Plymouth County with nearby schools including Rockland Senior High School, Calvary Chapel Academy, and Holy Family Elementary School.
Ownership History
Date
Name
Owned For
Owner Type
Purchase Details
Closed on
Apr 6, 2004
Sold by
Kenney Mark A and Kenney Paul N
Bought by
Kenney Mark A
Current Estimated Value
Home Financials for this Owner
Home Financials are based on the most recent Mortgage that was taken out on this home.
Original Mortgage
$165,000
Outstanding Balance
$77,105
Interest Rate
5.56%
Mortgage Type
Purchase Money Mortgage
Estimated Equity
$497,229
Create a Home Valuation Report for This Property
The Home Valuation Report is an in-depth analysis detailing your home's value as well as a comparison with similar homes in the area
Home Values in the Area
Average Home Value in this Area
Purchase History
| Date | Buyer | Sale Price | Title Company |
|---|---|---|---|
| Kenney Mark A | -- | -- |
Source: Public Records
Mortgage History
| Date | Status | Borrower | Loan Amount |
|---|---|---|---|
| Open | Kenney Mark A | $65,000 | |
| Open | Kenney Mark A | $165,000 |
Source: Public Records
Tax History Compared to Growth
Tax History
| Year | Tax Paid | Tax Assessment Tax Assessment Total Assessment is a certain percentage of the fair market value that is determined by local assessors to be the total taxable value of land and additions on the property. | Land | Improvement |
|---|---|---|---|---|
| 2025 | $6,775 | $495,600 | $240,900 | $254,700 |
| 2024 | $6,581 | $468,100 | $227,300 | $240,800 |
| 2023 | $6,561 | $431,100 | $208,500 | $222,600 |
| 2022 | $6,310 | $376,700 | $181,300 | $195,400 |
| 2021 | $0 | $338,900 | $164,800 | $174,100 |
| 2020 | $5,675 | $324,300 | $157,000 | $167,300 |
| 2019 | $5,562 | $310,400 | $149,500 | $160,900 |
| 2018 | $5,360 | $294,200 | $149,500 | $144,700 |
| 2017 | $5,250 | $284,100 | $149,500 | $134,600 |
| 2016 | $5,064 | $273,900 | $143,800 | $130,100 |
| 2015 | $5,014 | $263,500 | $134,400 | $129,100 |
| 2014 | $4,752 | $259,100 | $131,800 | $127,300 |
Source: Public Records
Map
Nearby Homes
- 35-37 Salem St
- 65 Boxberry Ln
- 775 Union St
- 7 Boxberry Ln Unit 7
- 94 Leisurewoods Dr
- 737-739 Union St
- 11 Hawthorne St
- 86 Leisurewoods Dr Unit 279
- 10 Horn Beam St Unit 299
- 3 Hickory Cir
- 5 Juniper Cir
- 9 Juniper Cir
- 83 Summit St
- 27 Fir Rd
- 540 Union St
- 40 Fir Rd Unit 386
- 12 Dyer St Unit 12
- 14 Dyer St Unit 14
- 11 Dyer St Unit 11
- 13 Dyer St Unit 13
- 55 Oregon Ave
- 77 Oregon Ave
- 64 Oregon Ave
- 74 Oregon Ave
- 80 Oregon Ave
- 68 Oregon Ave
- 69 Oregon Ave
- 22 Oregon Ave
- 88 Oregon Ave
- 15 Oregon Ave
- 102 Oregon Ave
- 18 Oregon Ave
- 1028 Union St
- 230 Greenwood St
- 221 Greenwood St
- 1008 Union St Unit 1010
- 1048 Union St
- 1000 Union St
- 209 Greenwood St
- LOT 231 Split Boulder Rd