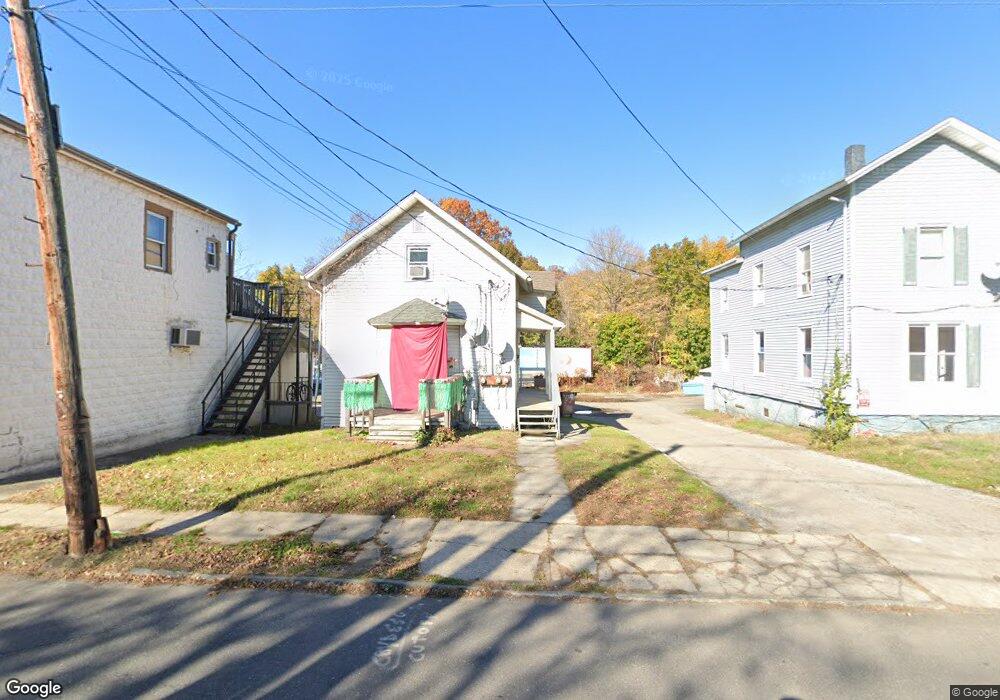
65 Rose St Danbury, CT 06810
Estimated Value: $181,797 - $495,000
3
Beds
3
Baths
902
Sq Ft
$444/Sq Ft
Est. Value
About This Home
This home is located at 65 Rose St, Danbury, CT 06810 and is currently estimated at $400,199, approximately $443 per square foot. 65 Rose St is a home located in Fairfield County with nearby schools including King Street Primary School, Broadview Middle School, and Danbury High School.
Ownership History
Date
Name
Owned For
Owner Type
Purchase Details
Closed on
Jun 2, 2023
Sold by
Ginsburg Jeffrey J
Bought by
Li Lu and Ginsburg Jeffrey
Current Estimated Value
Purchase Details
Closed on
Apr 10, 2000
Sold by
North East Coast Prop
Bought by
Ginsburg Jeffrey J
Purchase Details
Closed on
Oct 29, 1998
Sold by
Emc Mtg Corp
Bought by
N Eastcoast Prop Llc
Purchase Details
Closed on
May 14, 1993
Sold by
Union Trust Co
Bought by
Mtg Prop Corp
Create a Home Valuation Report for This Property
The Home Valuation Report is an in-depth analysis detailing your home's value as well as a comparison with similar homes in the area
Home Values in the Area
Average Home Value in this Area
Purchase History
| Date | Buyer | Sale Price | Title Company |
|---|---|---|---|
| Li Lu | -- | None Available | |
| Ginsburg Jeffrey J | $70,900 | -- | |
| N Eastcoast Prop Llc | $12,000 | -- | |
| Mtg Prop Corp | $40,781 | -- |
Source: Public Records
Mortgage History
| Date | Status | Borrower | Loan Amount |
|---|---|---|---|
| Previous Owner | Mtg Prop Corp | $68,900 |
Source: Public Records
Tax History Compared to Growth
Tax History
| Year | Tax Paid | Tax Assessment Tax Assessment Total Assessment is a certain percentage of the fair market value that is determined by local assessors to be the total taxable value of land and additions on the property. | Land | Improvement |
|---|---|---|---|---|
| 2025 | $3,859 | $154,420 | $49,700 | $104,720 |
| 2024 | $3,774 | $154,420 | $49,700 | $104,720 |
| 2023 | $3,603 | $154,420 | $49,700 | $104,720 |
| 2022 | $3,604 | $127,700 | $50,500 | $77,200 |
| 2021 | $3,525 | $127,700 | $50,500 | $77,200 |
| 2020 | $3,525 | $127,700 | $50,500 | $77,200 |
| 2019 | $3,525 | $127,700 | $50,500 | $77,200 |
| 2018 | $3,525 | $127,700 | $50,500 | $77,200 |
| 2017 | $2,872 | $99,200 | $48,200 | $51,000 |
| 2016 | $2,845 | $99,200 | $48,200 | $51,000 |
| 2015 | $2,803 | $99,200 | $48,200 | $51,000 |
| 2014 | $2,738 | $99,200 | $48,200 | $51,000 |
Source: Public Records
Map
Nearby Homes
- 63 Rose St
- 73 Rose St
- 75 Rose St
- 39 Rose St Unit C
- 39 Rose St Unit B
- 39 Rose St Unit D
- 39 Rose St
- 77 Rose St
- 64 Bells Ln Unit 4
- 64 Bells Ln Unit 2
- 64 1/2 Bells Ln
- 7 Ann Dr Unit C
- 7 Ann Dr Unit B
- 7 Ann Dr Unit A
- 34 Franklin St
- 32 Franklin St
- 36 Franklin St Unit C
- 36 Franklin St Unit A
- 36 Franklin St Unit E
- 36 Franklin St Unit D