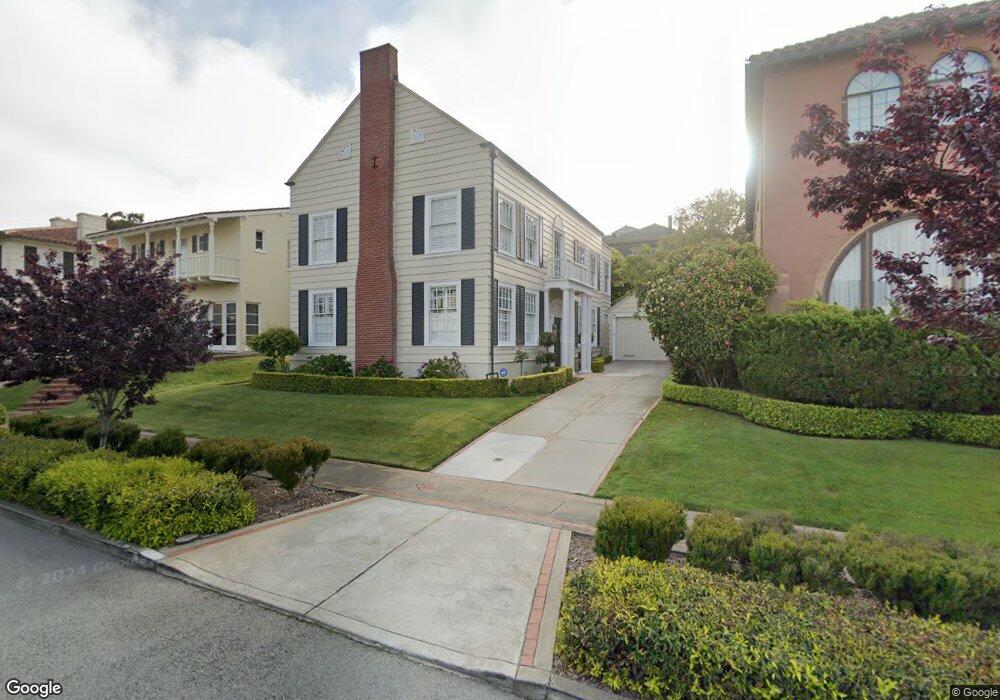
65 San Rafael Way San Francisco, CA 94127
Saint Francis Wood NeighborhoodEstimated Value: $2,625,000 - $3,361,000
4
Beds
3
Baths
2,812
Sq Ft
$1,080/Sq Ft
Est. Value
About This Home
This home is located at 65 San Rafael Way, San Francisco, CA 94127 and is currently estimated at $3,038,203, approximately $1,080 per square foot. 65 San Rafael Way is a home located in San Francisco County with nearby schools including Miraloma Elementary School, Denman (James) Middle School, and St. Stephen School.
Ownership History
Date
Name
Owned For
Owner Type
Purchase Details
Closed on
Aug 16, 2013
Sold by
Nakamura Lawrence H and Nakamura Sydney
Bought by
Nakamura Lawrence H and Nakamura Sydney
Current Estimated Value
Purchase Details
Closed on
May 2, 2002
Sold by
Aliabadi Faranak
Bought by
Nakamura Lawrence H and Nakamura Sydney
Home Financials for this Owner
Home Financials are based on the most recent Mortgage that was taken out on this home.
Original Mortgage
$892,500
Outstanding Balance
$358,780
Interest Rate
6.25%
Estimated Equity
$2,679,423
Purchase Details
Closed on
Jul 14, 1999
Sold by
Conklin Elmer D Marital Trust and May Frances T
Bought by
Aliabadi Faranak
Home Financials for this Owner
Home Financials are based on the most recent Mortgage that was taken out on this home.
Original Mortgage
$825,000
Interest Rate
7.37%
Purchase Details
Closed on
Sep 30, 1994
Sold by
Conklin Elmer D
Bought by
Conklin Elmer D
Create a Home Valuation Report for This Property
The Home Valuation Report is an in-depth analysis detailing your home's value as well as a comparison with similar homes in the area
Home Values in the Area
Average Home Value in this Area
Purchase History
| Date | Buyer | Sale Price | Title Company |
|---|---|---|---|
| Nakamura Lawrence H | -- | None Available | |
| Nakamura Lawrence H | $1,275,000 | First American Title Co | |
| Aliabadi Faranak | $1,100,000 | North American Title Co | |
| Conklin Elmer D | -- | -- |
Source: Public Records
Mortgage History
| Date | Status | Borrower | Loan Amount |
|---|---|---|---|
| Open | Nakamura Lawrence H | $892,500 | |
| Previous Owner | Aliabadi Faranak | $825,000 |
Source: Public Records
Tax History Compared to Growth
Tax History
| Year | Tax Paid | Tax Assessment Tax Assessment Total Assessment is a certain percentage of the fair market value that is determined by local assessors to be the total taxable value of land and additions on the property. | Land | Improvement |
|---|---|---|---|---|
| 2025 | $23,903 | $2,012,556 | $1,130,132 | $882,424 |
| 2024 | $23,903 | $1,973,096 | $1,107,973 | $865,123 |
| 2023 | $23,547 | $1,934,409 | $1,086,249 | $848,160 |
| 2022 | $21,672 | $1,774,911 | $1,064,950 | $709,961 |
| 2021 | $21,290 | $1,740,110 | $1,044,069 | $696,041 |
| 2020 | $21,431 | $1,722,268 | $1,033,364 | $688,904 |
| 2019 | $20,646 | $1,688,499 | $1,013,102 | $675,397 |
| 2018 | $19,951 | $1,655,392 | $993,238 | $662,154 |
| 2017 | $19,418 | $1,622,934 | $973,763 | $649,171 |
| 2016 | $19,114 | $1,591,113 | $954,670 | $636,443 |
| 2015 | $18,879 | $1,567,214 | $940,330 | $626,884 |
| 2014 | $18,382 | $1,536,516 | $921,911 | $614,605 |
Source: Public Records
Map
Nearby Homes
- 95 Junipero Serra Blvd
- 2978 20th Ave
- 345 Moncada Way
- 110 Santa Clara Ave
- 1475 Monterey Blvd
- 245 Westgate Dr
- 44 Yerba Buena Ave
- 75 San Jacinto Way
- 760 Darien Way
- 160 Wawona St
- 2 Westgate Dr
- 185 Upland Dr
- 92 San Pablo Ave
- 850 Darien Way
- 150 Upland Dr
- 155 Upland Dr
- 270 Claremont Blvd
- 2475 18th Ave
- 55 Upland Dr
- 40 Dorchester Way
- 55 San Rafael Way
- 75 San Rafael Way
- 160 San Fernando Way
- 170 San Fernando Way
- 45 San Rafael Way
- 150 San Fernando Way
- 95 San Rafael Way
- 180 San Fernando Way
- 72 San Rafael Way
- 50 San Rafael Way
- 76 San Rafael Way
- 35 San Rafael Way
- 40 San Rafael Way
- 2000 Monterey Blvd
- 2100 Monterey Blvd
- 130 San Fernando Way
- 30 San Rafael Way
- 25 San Rafael Way
- 120 San Fernando Way
- 55 Junipero Serra Blvd